

Analysis of distribution equilibrium and influencing factors for older adult meal service facilities in mainland China
- PMID: 40642240
- PMCID: PMC12243874
- DOI: 10.3389/fpubh.2025.1578827
Analysis of distribution equilibrium and influencing factors for older adult meal service facilities in mainland China
Abstract
Objective: Analyze the distribution equilibrium of older adult meal service facilities in mainland China and explore the factors influencing their distribution.
Methods: Use Python to obtain data on older adult meal service facilities, and analyze the equity of older adult meal services using descriptive statistics, the Lorenz curve, the Gini coefficient, and the Spatial Mismatch Index (SMI). A multiple linear regression model was applied to explore the relationships between older adult meal services and factors such as population, economy, infrastructure, geography, and policies.
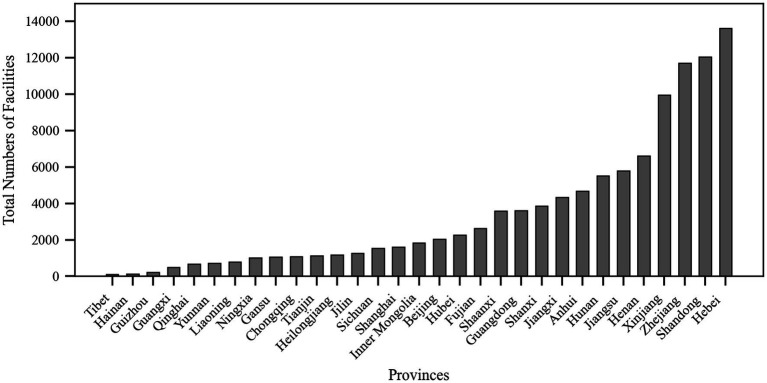
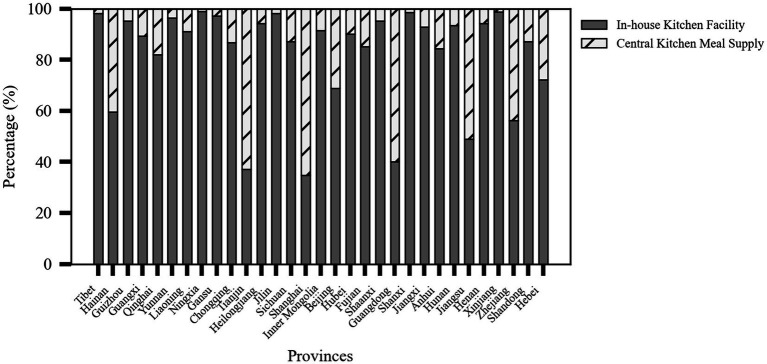
Results: The vast majority (85.26%) of older adult meal service facilities in mainland China are located at the community or village level, with the number of rural facilities significantly higher than that in urban areas. Most of these facilities are self-operated, and those with in-house kitchens dominate. The distribution of older adult meal services across mainland China was uneven, with a Gini coefficient of 0.418, indicating a substantial disparity in the allocation of service resources. The Spatial Mismatch Index (SMI) varied significantly among provinces, reflecting a considerable mismatch between the current supply of older adult meal service facilities and the actual demand of the older adult population. Analysis of influencing factors reveals that the number and coverage level of older adult meal service facilities were significantly negatively correlated with the size of the older adult population, the older adult dependency ratio, and GDP.
Conclusion: The equity of older adult meal services still needs improvement. The planning and implementation of meal services should place greater emphasis on population demand to ensure that older adult individuals across the country can fairly access the older adult meal services they deserve. Future policy formulation should comprehensively consider factors such as demographic structure, economic development levels, and infrastructure conditions to optimize resource allocation, reduce regional disparities, and enhance service coverage and quality.
Keywords: Gini coefficient; Spatial Mismatch Index; distribution equilibrium; influencing factors; older adult meal service.
Copyright © 2025 Wang, Zhou, Lv and Song.
Conflict of interest statement
The authors declare that the research was conducted in the absence of any commercial or financial relationships that could be construed as a potential conflict of interest.
Figures


References
-
- Ministry of Civil Affairs of the People's Republic of China, National Working Commission on Aging . 2023 national report on the development of aging affairs. (2023). Available online at:https://www.gov.cn [Accessed December 25, 2024].
-
- Bai C, Lei X. New trends in population aging and challenges for China’s sustainable development. China Econ J. (2019) 13:3–23. doi: 10.1080/17538963.2019.1700608 - DOI
MeSH terms
LinkOut - more resources
Full Text Sources