Circulating prosaposin and ependymin-related protein 1 levels are correlated with insulin resistance in type 2 diabetic patients
- PMID: 40642507
- PMCID: PMC12240745
- DOI: 10.3389/fendo.2025.1519586
Circulating prosaposin and ependymin-related protein 1 levels are correlated with insulin resistance in type 2 diabetic patients
Abstract
Objective: Skeletal muscle and adipose tissues secrete myokines and adipokines to regulate energy metabolism. Experimental evidence indicates that prosaposin (PSAP) and ependymin-related protein 1 (EPDR1) are involved in the regulation of thermogenesis and energy metabolism. To our knowledge, little literature has been found dealing with PSAP and EPDR1 levels in type 2 diabetes mellitus (T2DM) patients. The aim of the study was to evaluate possible relationships between both peptide levels and insulin resistance indexes in type 2 diabetic subjects.
Methods: The study groups consisted of 64 T2DM subjects and 22 normal controls. Serum PSAP and EPDR1 concentrations were determined using immunosorbent assay kits.
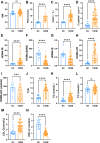
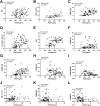
Results: The serum PSAP (319.6 ± 78.38 vs. 207.2 ± 42.43, P<0.0001) and EPDR1 (7.988 ± 3.484 vs. 6.399 ± 3.788, P=0.0823) concentrations were higher in T2DM subjects than normal controls. In addition, positive correlations were found between: PSAP and fasting blood glucose (FBG) levels (r = 0.5004; P< 0.0001), PSAP and Hemoglobin A1c (HAb1c) (r = 0.4688; P< 0.0001), PSAP and C-peptide (r = 0.3981; P = 0.0003), PSAP and triglyceride-glucose index (TyG) (r = 0.2362; P< 0.0001), PSAP and homeostasis model assessment of insulin resistance (HOMA-IR) (r = 0.3314; P = 0.0035), PSAP and homeostasis model assessment of C-peptide resistance (HOMA-CR) (r = 0.5486; P< 0.0001), EPDR1 and insulin (r = 0.2291; P = 0.045), EPDR1 and HOMA-IR (r = 0.2462; P = 0.0309) in both T2DM and normal control subjects.
Conclusions: Our results indicated that T2DM individuals have higher serum PSAP and EPDR1 levels, and both peptide concentrations were positively correlative to insulin (INS) resistance levels. PSAP and EPDR1 levels may be taken as potential biomarkers to forecast the development of T2DM.
Keywords: EPDR1; PSAP; T2DM; adipokine; insulin resistance.
Copyright © 2025 Ji, Wang, Xu, Cao, Fang and Zhang.
Conflict of interest statement
The authors declare that the research was conducted in the absence of any commercial or financial relationships that could be construed as a potential conflict of interest.
Figures


Similar articles
-
Serum Isthmin-1 levels are positively correlated with macrovascular complications in type 2 diabetic patients.Front Endocrinol (Lausanne). 2025 Jun 26;16:1594158. doi: 10.3389/fendo.2025.1594158. eCollection 2025. Front Endocrinol (Lausanne). 2025. PMID: 40642506 Free PMC article.
-
Ependymin-related protein 1 levels are elevated in children with obesity and correlated with metabolic disorders.Pediatr Discov. 2023 Aug 14;2(1):e25. doi: 10.1002/pdi3.25. eCollection 2024 Mar. Pediatr Discov. 2023. PMID: 40626250 Free PMC article.
-
Association of circulating 25-hydroxyvitamin D with time in range and insulin secretion in type 2 diabetes.Front Endocrinol (Lausanne). 2025 Jul 7;16:1573963. doi: 10.3389/fendo.2025.1573963. eCollection 2025. Front Endocrinol (Lausanne). 2025. PMID: 40692600 Free PMC article.
-
Association between markers of glucose metabolism and risk of colorectal cancer.BMJ Open. 2016 Jun 27;6(6):e011430. doi: 10.1136/bmjopen-2016-011430. BMJ Open. 2016. PMID: 27354075 Free PMC article.
-
Effect of Camel Milk on Glucose Homeostasis in Patients with Diabetes: A Systematic Review and Meta-Analysis of Randomized Controlled Trials.Nutrients. 2022 Mar 15;14(6):1245. doi: 10.3390/nu14061245. Nutrients. 2022. PMID: 35334901 Free PMC article.
References
MeSH terms
Substances
LinkOut - more resources
Full Text Sources
Medical
Research Materials
Miscellaneous

