

Nature-Inspired Compounds Targeting Escherichia coli WrbA as Biofilm-Modulating Agents: Computational Design, Synthesis, and Biological Evaluation
- PMID: 40643025
- PMCID: PMC12247152
- DOI: 10.1002/ardp.70049
Nature-Inspired Compounds Targeting Escherichia coli WrbA as Biofilm-Modulating Agents: Computational Design, Synthesis, and Biological Evaluation
Abstract
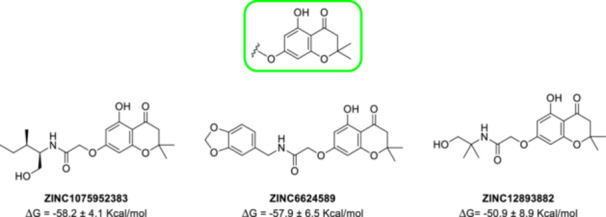
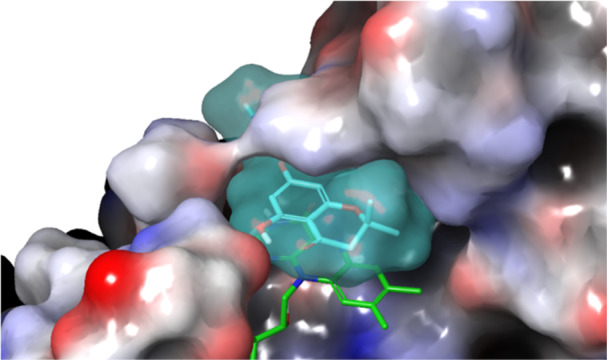
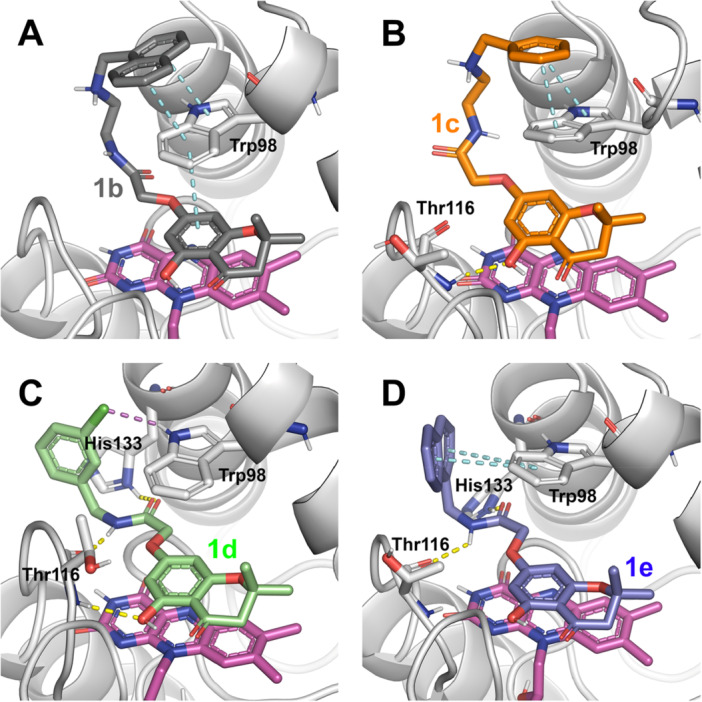
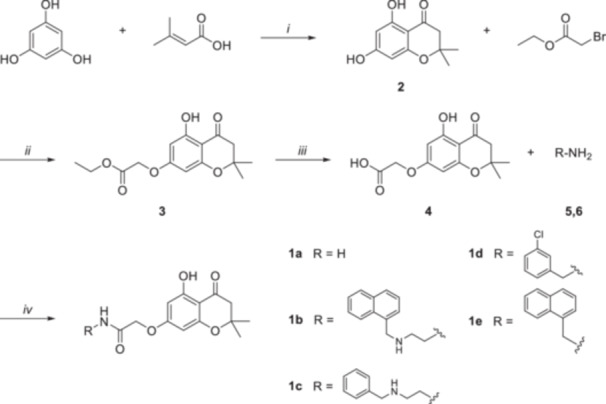
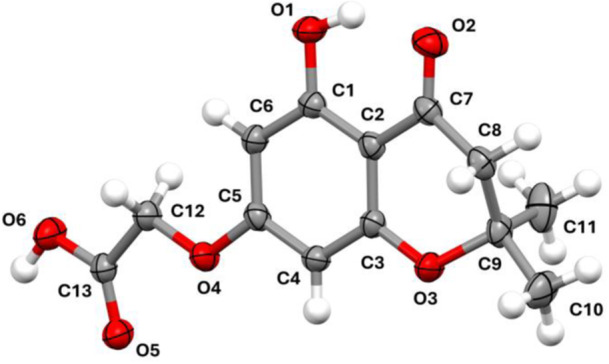
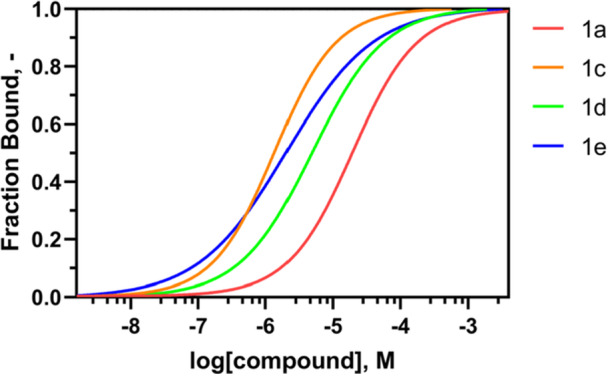
Biofilms pose significant challenges in multiple settings due to their resistance to conventional treatments. In this study, we designed and synthesized a novel class of nature-inspired 5,7-dihydroxy-2,2-dimethylchroman-4-one derivatives as binders of WrbA, a potential target for biofilm modulation. Using a structure-based computational approach, a small library of analogs with varied amide moieties was developed and synthesized. The evaluation of their binding affinity to WrbA demonstrated good-to-excellent Kd values, as confirmed by microscale thermophoresis (MST). Antibiofilm assays against Escherichia coli and Staphylococcus aureus revealed different modulating effects on biofilm formation, conceivably linked to ROS production. These findings emphasize the importance of ROS levels in biofilm, as well as the pivotal role of WrbA as a target in its regulation.
Keywords: MM‐GBSA; antibiofilm assay; chroman‐4‐one derivatives; microscale thermophoresis; reactive oxygen species.
© 2025 The Author(s). Archiv der Pharmazie published by Wiley‐VCH GmbH on behalf of Deutsche Pharmazeutische Gesellschaft.
Conflict of interest statement
The authors declare no conflicts of interest.
Figures
Similar articles
-
Synthesis of 1-(2-Hydroxy-5-methylphenyl)-5-oxopyrrolidine-3-carboxylic Acid Derivatives as a Promising Scaffold Against Disease-Causing Bacteria Relevant to Public Health.Molecules. 2025 Jun 18;30(12):2639. doi: 10.3390/molecules30122639. Molecules. 2025. PMID: 40572602 Free PMC article.
-
Antibacterial and antibiofilm agents in the group of xanthone derivatives with piperazine moiety active against drug-resistant Helicobacter pylori strains.Bioorg Chem. 2024 Dec;153:107755. doi: 10.1016/j.bioorg.2024.107755. Epub 2024 Aug 30. Bioorg Chem. 2024. PMID: 39243741
-
Design, synthesis, and biological evaluation of novel vanillin-derived hydrazone compounds with antimicrobial, anticancer, and enzyme inhibition activities, along with molecular structure and drug-likeness assessment.Biochem Biophys Res Commun. 2025 Aug 15;775:152173. doi: 10.1016/j.bbrc.2025.152173. Epub 2025 Jun 7. Biochem Biophys Res Commun. 2025. PMID: 40489929
-
Development and Prevention of Biofilm on Cochlear Implants: A Systematic Review.Medicina (Kaunas). 2024 Nov 28;60(12):1959. doi: 10.3390/medicina60121959. Medicina (Kaunas). 2024. PMID: 39768840 Free PMC article.
-
Antibiofilm Effects of Novel Compounds in Otitis Media Treatment: Systematic Review.Int J Mol Sci. 2024 Nov 29;25(23):12841. doi: 10.3390/ijms252312841. Int J Mol Sci. 2024. PMID: 39684553 Free PMC article.
References
-
- Ciofu O., Moser C., Jensen P. Ø., and Høiby N., “Tolerance and Resistance of Microbial Biofilms,” Nature Reviews Microbiology 20 (2022): 621–635. - PubMed
MeSH terms
Substances
LinkOut - more resources
Full Text Sources
Medical
