. 2025 Jun 23;14(13):958.
doi: 10.3390/cells14130958.

Identification of Transcriptomic Differences in Induced Pluripotent Stem Cells and Neural Progenitors from Amyotrophic Lateral Sclerosis Patients Carrying Different Mutations: A Pilot Study

Affiliations

Identification of Transcriptomic Differences in Induced Pluripotent Stem Cells and Neural Progenitors from Amyotrophic Lateral Sclerosis Patients Carrying Different Mutations: A Pilot Study

Chiara Sgromo et al. Cells. .

Abstract

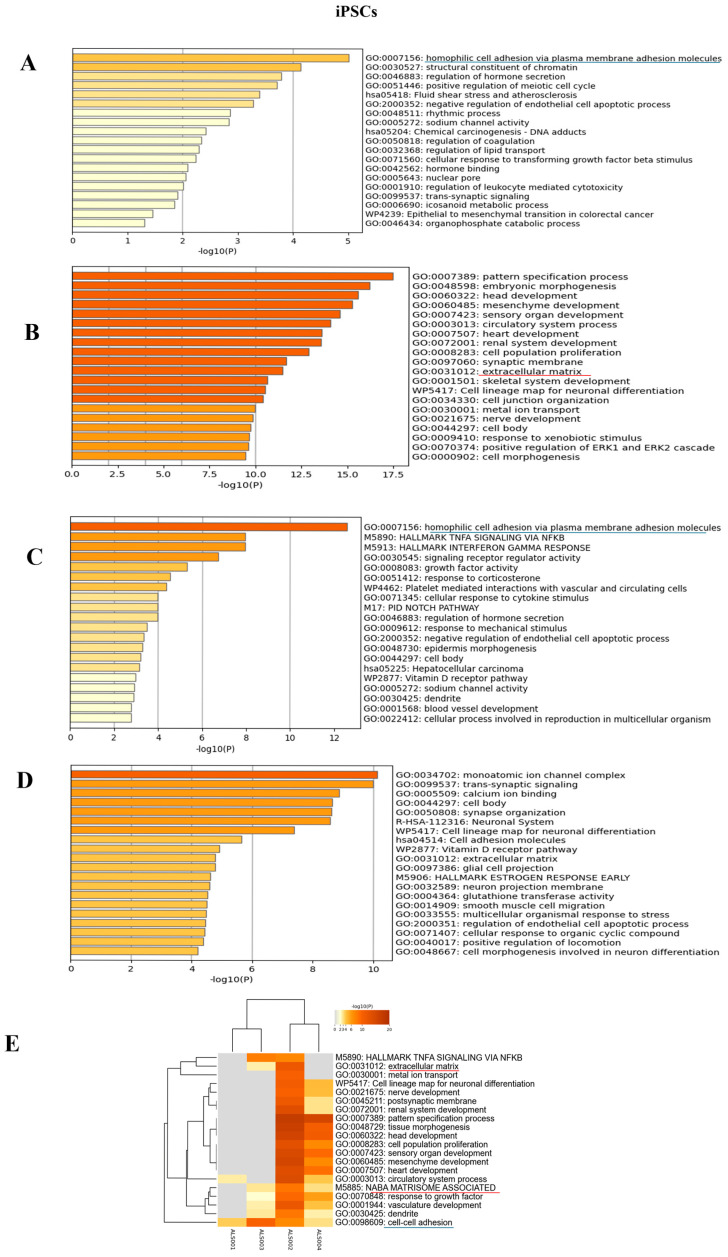
Amyotrophic lateral sclerosis (ALS) is a devastating neurodegenerative disease affecting motor neurons with a phenotypic and genetic heterogeneity and elusive molecular mechanisms. With the present pilot study, we investigated different genetic mutations (C9orf72, TARDBP, and KIF5A) associated with ALS by generating induced pluripotent stem cells (iPSCs) from peripheral blood of ALS patients and healthy donors. iPSCs showed the typical morphology, expressed stem cell markers both at RNA (OCT4, SOX2, KLF4, and c-Myc) and protein (Oct4, Sox2, SSEA3, and Tra1-60) levels. Moreover, embryoid bodies expressing the three germ-layer markers and neurospheres expressing neural progenitor markers were generated. Importantly, the transcriptomic profiles of iPSCs and neurospheres were analyzed to highlight the differences between ALS patients and healthy controls. Interestingly, the differentially expressed genes (DEGs) shared across all ALS iPSCs are linked to extracellular matrix, highlighting its importance in ALS progression. In contrast, ALS neurospheres displayed widespread deficits in neuronal pathways, although these DEGs were varied among patients, reflecting the disease's heterogeneity. Overall, we generated iPSC lines from ALS patients with diverse genetic backgrounds offering a tool for unravelling the intricate molecular landscape of ALS, paving the way for identifying key pathways implicated in pathogenesis and the disease's phenotypic variability.

Keywords: Amyotrophic lateral sclerosis; RNA-seq; induced pluripotent stem cells; neural progenitor cells; transcriptomic analysis.


Conflict of interest statement

The authors declare no conflicts of interest.

Figures

Figure 1
Figure 1
CD34+ cells reprogramming into iPSCs. (A) List of ALS and healthy donors from whom iPSCs were generated. (B) Upper panel: Representative phase-contrast microscopy showing ESC-like morphology of both healthy and ALS CD34+ cell-derived iPSCs. Lower panel: Positivity for alkaline phosphatase staining of healthy and ALS iPSCs. Scale bars, 100 μm.
Figure 2
Figure 2
Characterization of healthy and ALS iPSCs. (A) RT-PCR for exogenous factors on healthy and ALS iPSCs. iPSCs from a healthy donor 15 days after reprogramming with Sendai virus was used as positive control. (B) RT-PCR for endogenous factors (OCT4, SOX2, c-Myc, and KLF4) on healthy and ALS iPSCs. HEK293T cells transduced with the Sendai virus were used as positive control. (C) Stem-cell marker expression at the protein level was detected by immunofluorescence on healthy and ALS iPSCs. Markers used were: OCT4 (green), SOX2 (green), SSEA3 (green), TRA1-60 (red), and DAPI (blue). Scale bars, 200 μm. (D) Western blot analysis of C9orf72, KIF5A, and TDP-43 expression. Positive controls: C9orf72: SH-SY5Y cell line; KIF5A: SH-SY5Y cell line; TDP-43: MDA-MB-231 cell line. (E) Representative image of EB generated from the culture of iPSCs in low adhesion plate. Scale bar, 100 μm. (F) RT-PCR for the three germ-layer markers on iPSCs-derived EBs: OTX2, NCAM, and NES (ectoderm); ACTA2, TBX6, and TBXT (mesoderm); AFP, SOX17, and FOXA2 (endoderm). All data are representative of three independent experiments.
Figure 2
Figure 2
Characterization of healthy and ALS iPSCs. (A) RT-PCR for exogenous factors on healthy and ALS iPSCs. iPSCs from a healthy donor 15 days after reprogramming with Sendai virus was used as positive control. (B) RT-PCR for endogenous factors (OCT4, SOX2, c-Myc, and KLF4) on healthy and ALS iPSCs. HEK293T cells transduced with the Sendai virus were used as positive control. (C) Stem-cell marker expression at the protein level was detected by immunofluorescence on healthy and ALS iPSCs. Markers used were: OCT4 (green), SOX2 (green), SSEA3 (green), TRA1-60 (red), and DAPI (blue). Scale bars, 200 μm. (D) Western blot analysis of C9orf72, KIF5A, and TDP-43 expression. Positive controls: C9orf72: SH-SY5Y cell line; KIF5A: SH-SY5Y cell line; TDP-43: MDA-MB-231 cell line. (E) Representative image of EB generated from the culture of iPSCs in low adhesion plate. Scale bar, 100 μm. (F) RT-PCR for the three germ-layer markers on iPSCs-derived EBs: OTX2, NCAM, and NES (ectoderm); ACTA2, TBX6, and TBXT (mesoderm); AFP, SOX17, and FOXA2 (endoderm). All data are representative of three independent experiments.
Figure 3
Figure 3
Neurosphere generation and characterization. (A) Schematic representation of neurosphere differentiation. (B) Representative images of neurospheres generated from healthy and ALS iPSCs. Scale bar, 100 μm. (C) RT-PCR for the expression of the neuroectoderm markers. Hela and iPSC were used as positive control. All data are representative of three independent experiments.
Figure 4
Figure 4
Heatmaps of the differentially expressed genes in iPSCs: Heatmaps of the differentially expressed genes of each of the four ALS patients in comparison to the matched healthy controls. Patients’ differentially expressed genes are represented on the left (top red bar); healthy controls’ differentially expressed genes are represented on the right (top green bar). (A): ALS001_KIF5A vs. HC; (B): ALS002_TARDBP vs. HC; (C): ALS003_c9orf72 vs. HC; (D): ALS004_TARDBP vs. HC.
Figure 5
Figure 5
Heatmaps of the differentially expressed genes in neurospheres: Heatmaps of the differentially expressed genes of each of the four ALS patients in comparison to the matched healthy controls. Patients’ differentially expressed genes are represented on the left (top red bar); healthy controls’ differentially expressed genes are represented on the right (top green bar). (A): ALS001_KIF5A vs. HC; (B): ALS002_TARDBP vs. HC; (C): ALS003_c9orf72 vs. HC; (D): ALS004_TARDBP vs. HC.
Figure 6
Figure 6
Enrichment analysis: Enrichment analysis results of the comparison between each of the four ALS patients and the matched healthy controls, at iPSC level. (A): Enrichment analysis for ALS001_KIF5A vs. HC; (B): enrichment analysis for ALS002_TARDBP vs. HC; (C): enrichment analysis for ALS003_c9orf72 vs. HC; (D): enrichment analysis results for ALS004_TARDBP vs. HC; (E): integrative and comparative enrichment analysis among the four subjects. The DEGs for all comparisons include either upregulated or downregulated genes. At iPSC level, we underlined in different colors the shared pathways (blue for cell-adhesion pathways and red for matrisome, extracellular-matrix pathways).
Figure 7
Figure 7
Enrichment analysis: Enrichment analysis results of the comparison between each of the four ALS patients and the matched healthy controls, at neurosphere level. (A): Enrichment analysis for ALS001_KIF5A vs. HC; (B): enrichment analysis for ALS002_TARDBP vs. HC; (C): enrichment analysis for ALS003_c9orf72 vs. HC; (D): enrichment analysis results for ALS004_TARDBP vs. HC; (E): integrative and comparative enrichment analysis among the four subjects. The DEGs for all comparisons include either upregulated or downregulated genes.

References

    1. Feldman E.L., Goutman S.A., Petri S., Mazzini L., Savelieff M.G., Shaw P.J., Sobue G. Amyotrophic Lateral Sclerosis. Lancet. 2022;400:1363–1380. doi: 10.1016/S0140-6736(22)01272-7. - DOI - PMC - PubMed
    1. Goutman S.A., Hardiman O., Al-Chalabi A., Chió A., Savelieff M.G., Kiernan M.C., Feldman E.L. Emerging Insights into the Complex Genetics and Pathophysiology of Amyotrophic Lateral Sclerosis. Lancet Neurol. 2022;21:465–479. doi: 10.1016/S1474-4422(21)00414-2. - DOI - PMC - PubMed
    1. Pang W., Hu F. Cellular and Physiological Functions of C9ORF72 and Implications for ALS/FTD. J. Neurochem. 2021;157:334–350. doi: 10.1111/jnc.15255. - DOI - PMC - PubMed
    1. Frick P., Sellier C., Mackenzie I.R.A., Cheng C.-Y., Tahraoui-Bories J., Martinat C., Pasterkamp R.J., Prudlo J., Edbauer D., Oulad-Abdelghani M., et al. Novel Antibodies Reveal Presynaptic Localization of C9orf72 Protein and Reduced Protein Levels in C9orf72 Mutation Carriers. Acta Neuropathol. Commun. 2018;6:72. doi: 10.1186/s40478-018-0579-0. - DOI - PMC - PubMed
    1. Hulisz D. Amyotrophic Lateral Sclerosis: Disease State Overview. Am. J. Manag. Care. 2018;24:S320–S326. - PubMed

LinkOut - more resources