. 2025 Jun 24;14(13):970.
doi: 10.3390/cells14130970.

Epigenetic Changes Regulating Epithelial-Mesenchymal Plasticity in Human Trophoblast Differentiation

Affiliations

Epigenetic Changes Regulating Epithelial-Mesenchymal Plasticity in Human Trophoblast Differentiation

William E Ackerman Iv et al. Cells. .

Abstract

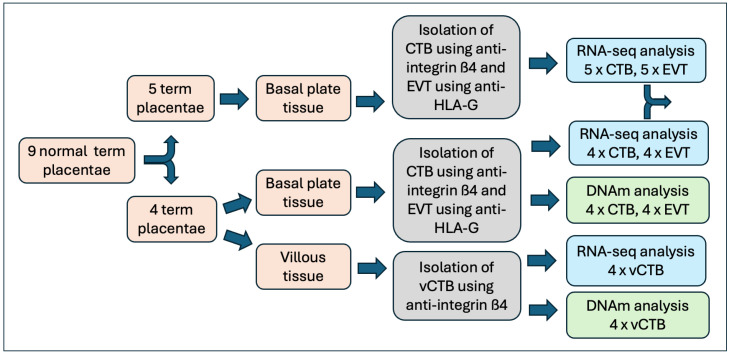
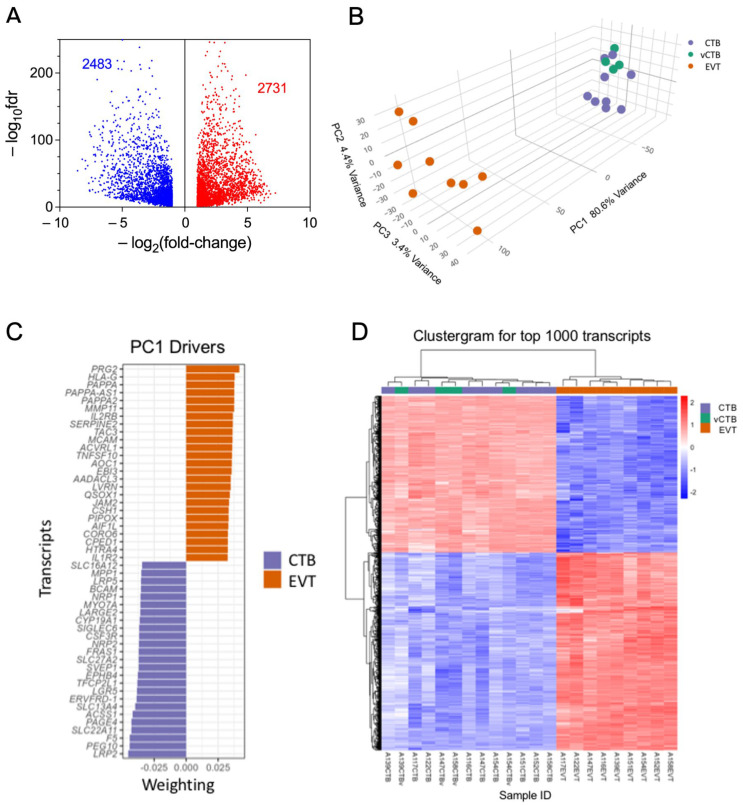
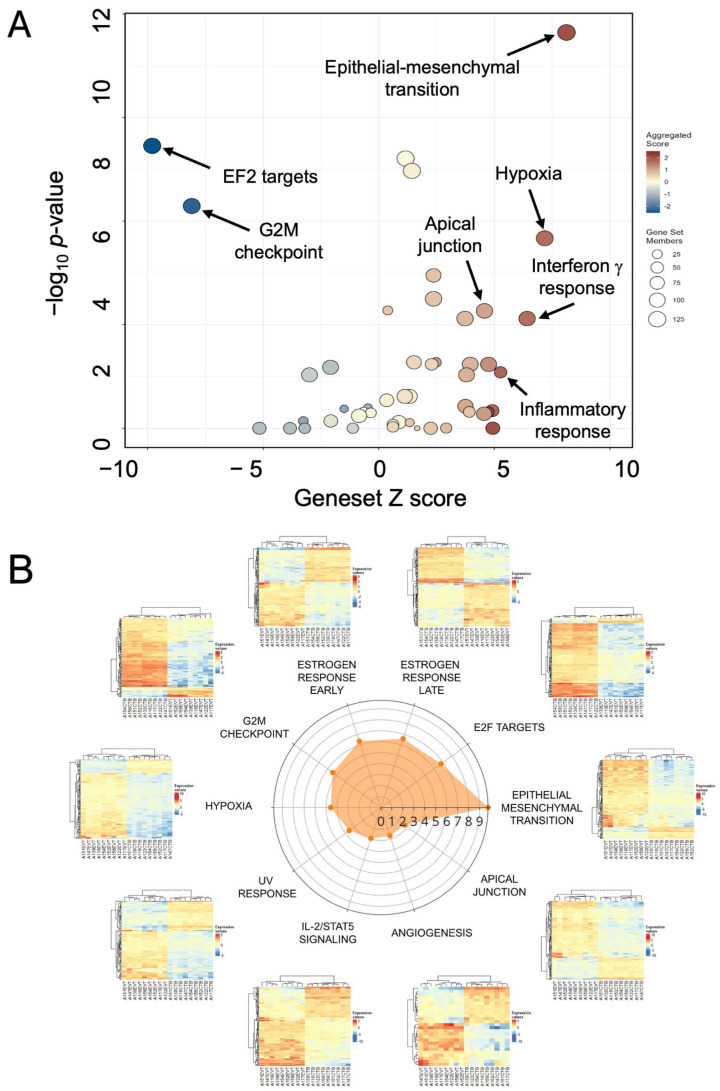
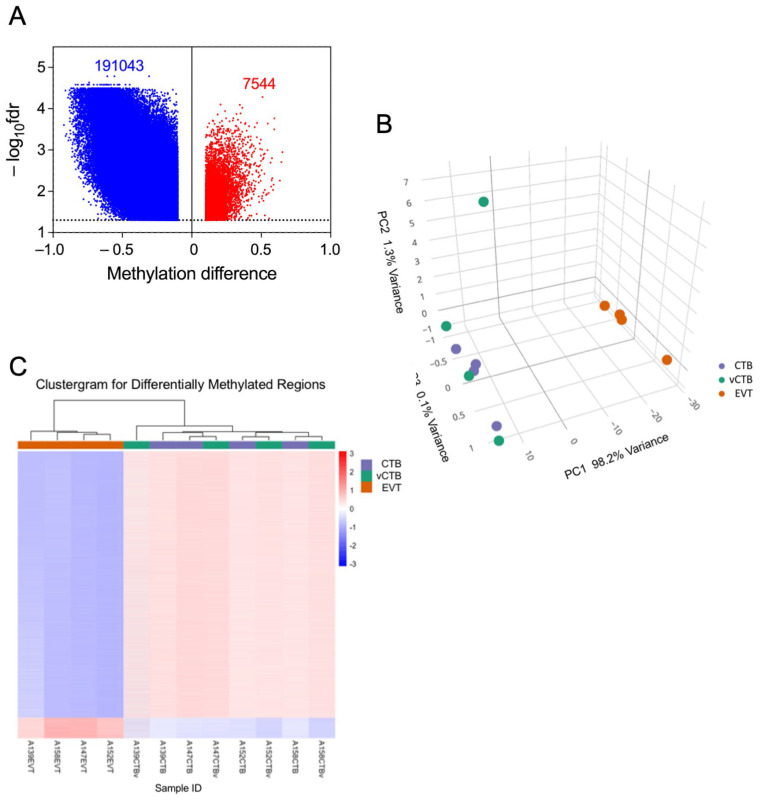
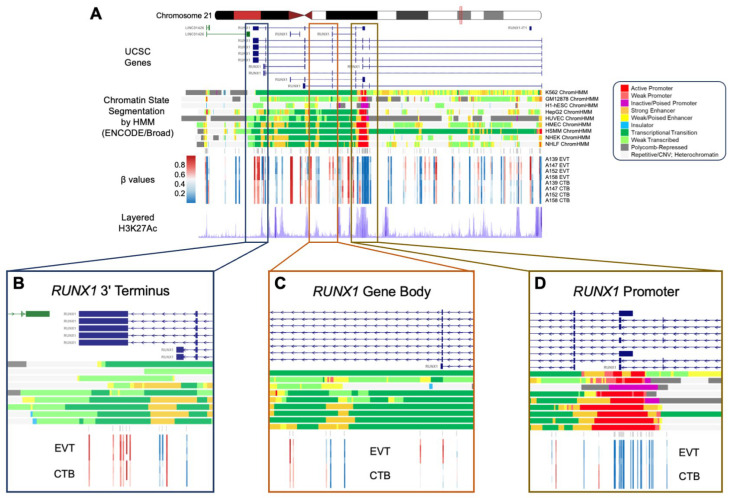
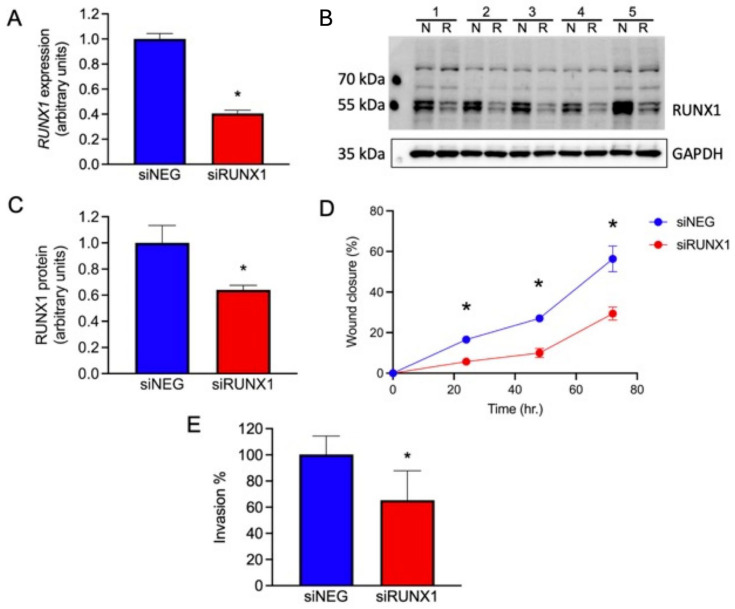
The phenotype of human placental extravillous trophoblast (EVT) at the end of pregnancy reflects both differentiation from villous cytotrophoblast (CTB) and later gestational changes, including loss of proliferative and invasive capacity. Invasion abnormalities are central to major obstetric pathologies, including placenta accreta spectrum, early onset preeclampsia, and fetal growth restriction. Characterization of the normal differentiation processes is, thus, essential for the analysis of these pathologies. Our gene expression analysis, employing purified human CTB and EVT cells, demonstrates a mechanism similar to the epithelial-mesenchymal transition (EMT), which underlies CTB-EVT differentiation. In parallel, DNA methylation profiling shows that CTB cells, already hypomethylated relative to non-trophoblast cell lineages, show further genome-wide hypomethylation in the transition to EVT. A small subgroup of genes undergoes gains of methylation (GOM), associated with differential gene expression (DE). Prominent in this GOM-DE group are genes involved in epithelial-mesenchymal plasticity (EMP). An exemplar is the transcription factor RUNX1, for which we demonstrate a functional role in regulating the migratory and invasive capacities of trophoblast cells. This analysis highlights epigenetically regulated genes acting to underpin the epithelial-mesenchymal plasticity characteristic of human trophoblast differentiation. Identification of these elements provides important information for the obstetric disorders in which these processes are dysregulated.

Keywords: DNA methylation; differentiation; epithelial–mesenchymal transition; trophoblast.


Conflict of interest statement

The authors declare that the research was conducted in the absence of any commercial or financial relationships that could be construed as a potential conflict of interest. The funders had no role in the design of the study; in the collection, analyses, or interpretation of data; in the writing of the manuscript; or in the decision to publish the results.

Figures

Figure 1
Figure 1
Flowchart showing preparative and analytical steps.
Figure 2
Figure 2
Analysis of RNA sequencing data. (A) Volcano plot of RNA sequencing DE data showing decreased expression in EVT (blue) and increased expression (red). Paired analysis, using the threshold parameters of (1) FDR ≤ 0.05, (2) featureCount (baseMean) ≥ 10, and (3) a fold change of ≥1.5. (B) PCA plot of CTB (purple), vCTB (green), and EVT (orange) using the full DE gene set. (C) Top 50 driver genes (25 positive, 25 negative) for the first component of the PCA. (D) Clustergram for CTB (purple), vCTB (green), and EVT (orange) for the top 1000 genes.
Figure 3
Figure 3
Functional enrichment of differentially expressed genes in EVT. (A) Volcano/bubble plot of enrichment drawn from the Hallmark database of gene sets. (B) Radar plot of the top 10 enriched gene sets. Each heatmap shows the nine lanes for CTB on the left and nine for EVT on the right.
Figure 4
Figure 4
Differential gene expression between CTB and EVT in first- and third-trimester gene sets. (A) Venn diagram showing differentially expressed EMT-associated genes from third-trimester datasets GSE256412 (blue) and GSE173323 (red). (B) Venn diagram showing differentially expressed EMT-associated genes from third-trimester datasets GSE256412 (blue), GSE173323 (red), and first-trimester datasets GSE1265230 (brown), GSE163651 (green), and GSE173323 (purple).
Figure 5
Figure 5
Differential methylation of genes in EVT compared to CTB. (A) Volcano plot showing differences in total methylation (decreased—blue, increased—red) between CTB and EVT. Dotted line marks fdr = 0.05 cut-off. (B) PCA plot of the methylome for CTB (purple), vCTB (green), and EVT (orange). (C) Clustergram showing differences in methylation between vCTB, CTB, and EVT.
Figure 6
Figure 6
Regional RUNX1 gene body hypermethylation in EVTs relative to CTBs. (A) Integrative genomics viewer (IGV) visualization of the genomic region around RUNX1 (Chr21: 36,110,847–36,448,197; hg19 coordinates) displaying the chromosome 21 ideogram and the following tracks: (1) UCSC known genes track showing RUNX1 transcripts (blue) and antisense LINC01426 transcripts (green); (2) Chromatin State Segmentation by Hidden Markov Model (ChromHMM) track for nine ENCODE cell lines; (3) Illumina 850 k EPIC methylation array track showing positions of CpG sites being measured; (4) heatmap representation of DNA methylation (β values) for EVT and CTB samples; (5) layered H3K27Ac track (epigenetic mark for active regulatory elements). (BD) Enlarged views of three regions from the RUNX1 gene (3′ terminus, gene body, 5′ promoter), showing DNA methylation changes in relation to genomic and epigenomic features. The ChromHMM display conventions are as in https://genome.ucsc.edu/cgi-bin/hgTrackUi?g=wgEncodeBroadHmm, accessed on 5 January 2019.
Figure 7
Figure 7
Role of RUNX1 in trophoblast. Changes in RUNX1 message, protein, and in migration and invasion of JEG3 cells following treatment with siNEG or siRUNX1. Statistical analysis was performed by a paired t-test for all measures. (A) RUNX1 gene expression, normalized to YWHAZ; n = 4, * p < 0.001. (B) Western blot of JEG3 cells for RUNX1 and GAPDH following treatment with siNEG (N) or siRUNX1 (R). (C) Quantification of RUNX1 protein expression, normalized to GAPDH, in JEG3 cells following treatment with siNEG or siRUNX1; n = 5, * p < 0.01. (D) Migration of JEG3 cells following treatment with siNEG or siRUNX1, measured as a percentage of wound closure; n = 3; * p < 0.05. (E) Invasion of siRUNX1-treated JEG3 through Matrigel-coated Transwell membranes, measured as a percentage of invasion by siNEG-treated cells; n = 16; * p < 0.001.

Update of

Similar articles

References

    1. Knofler M., Haider S., Saleh L., Pollheimer J., Gamage T., James J. Human placenta and trophoblast development: Key molecular mechanisms and model systems. Cell Mol. Life Sci. 2019;76:3479–3496. doi: 10.1007/s00018-019-03104-6. - DOI - PMC - PubMed
    1. Weiss G., Sundl M., Glasner A., Huppertz B., Moser G. The trophoblast plug during early pregnancy: A deeper insight. Histochem. Cell Biol. 2016;146:749–756. doi: 10.1007/s00418-016-1474-z. - DOI - PMC - PubMed
    1. Phipps E.A., Thadhani R., Benzing T., Karumanchi S.A. Pre-eclampsia: Pathogenesis, novel diagnostics and therapies. Nat. Rev. Nephrol. 2019;15:275–289. doi: 10.1038/s41581-019-0119-6. - DOI - PMC - PubMed
    1. Roberts J.M., Rich-Edwards J.W., McElrath T.F., Garmire L., Myatt L., Global Pregnancy C. Subtypes of Preeclampsia: Recognition and Determining Clinical Usefulness. Hypertension. 2021;77:1430–1441. doi: 10.1161/HYPERTENSIONAHA.120.14781. - DOI - PMC - PubMed
    1. Tantbirojn P., Crum C.P., Parast M.M. Pathophysiology of placenta creta: The role of decidua and extravillous trophoblast. Placenta. 2008;29:639–645. doi: 10.1016/j.placenta.2008.04.008. - DOI - PubMed

MeSH terms

Substances

LinkOut - more resources