. 2025 Jun 25;14(13):976.
doi: 10.3390/cells14130976.

From Brain to Blood: Uncovering Potential Therapeutical Targets and Biomarkers for Huntington's Disease Using an Integrative RNA-Seq Analytical Platform (BDASeq®)

Affiliations

From Brain to Blood: Uncovering Potential Therapeutical Targets and Biomarkers for Huntington's Disease Using an Integrative RNA-Seq Analytical Platform (BDASeq®)

João Rafael Dias Pinto et al. Cells. .

Abstract

Background: Huntington's Disease (HD) remains without disease-modifying treatments, with existing therapies primarily targeting chorea symptoms and offering limited benefits. This study aims to identify druggable genes and potential biomarkers for HD, focusing on using RNA-Seq analysis to uncover molecular targets and improve clinical trial outcomes.

Methods: We reanalyzed transcriptomic data from six independent studies comparing cortex samples of HD patients and healthy controls. The Propensity Score Matching (PSM) algorithm was applied to match cases and controls by age. Differential expression analysis (DEA) coupled with machine learning algorithms were coupled to identify differentially expressed genes (DEGs) and potential biomarkers in HD.

Results: Our analysis identified 5834 DEGs, including 394 putative druggable genes involved in processes like neuroinflammation, metal ion dysregulation, and blood-brain barrier dysfunction. These genes' expression levels correlated with CAG repeat length, disease onset, and progression. We also identified FTH1 as a promising biomarker for HD, with its expression downregulated in the prefrontal cortex and upregulated in peripheral blood in a CAG repeat-dependent manner.

Conclusions: This study highlights the potential of FTH1 as both a biomarker and a therapeutic target for HD. Advanced bioinformatics approaches like RNA-Seq and PSM are crucial for uncovering novel targets in HD, paving the way for better therapeutic interventions and improved clinical trial outcomes. Further validation of FTH1's role is needed to confirm its utility in HD.

Keywords: CAG repeat; FTH1; Huntington’s disease; RNA-Seq; biomarker; blood–brain barrier; druggable genes; neuroinflammation; propensity score matching; transcriptomics.


Conflict of interest statement

The authors J.R.D.P., R.P.A., and B.F.N. declare conflicts of interest with BioDecision AnalyticsTM. J.R.D.P., R.P.A., and B.F.N. are inventors of BDASeq®, a computer program developed and registered in Brazil (registration number BR512025001097-4). Supporting funding obtained for this study was obtained for J.R.D.P., R.P.A., and B.F.N. (BioDecision Analytics Ltd.). J.R.D.P., R.P.A. and B.F.N have been involved as consultants in BioDecision AnalyticsTM.

Figures

Figure A1
Figure A1
Waterfall plot showing the total number of available brain BioSamples (FASTQ files, n = 778, in grey) included in the 12 BioProjects, as well as the final number of eligible BioSamples (n = 353, in blue) in this study. Note that 425 BioSamples were excluded (jn purple). From the 353 eligible BioSamples, there are 207 BioSamples from neurologically normal individuals (n = 207) and 146 BioSamples from HD-positive symptomatic individuals (n = 146). Doted line describes the reduction in number of samples due to the removal of non-eligible BioSamples.
Figure A2
Figure A2
Age distribution between cases (n = 146) and controls (n = 207), (A). Results show a statistically significant difference between the age of cases and controls (B). Statistical analysis performed using t-Student test, with a significance level of 5%. Doted lines show the mean of each sample distribution.
Figure A3
Figure A3
Dimensional reduction analysis through the UMAP technique, showing that transcriptomic profiles from HD-positive individuals (in blue, n = 146) differ from neurologically normal controls (in gray, n = 207), (A). Clustering analysis using DBSCAN shows the analyzed transcriptomic profiles grouped into three distinct clusters (B). Clustering analysis shows that clusters zero (C0) and one (C1) mostly comprised transcriptomic profiles from neurologically normal controls, whereas cluster two (C2) mostly contains transcriptomic profiles from HD-positive individuals (C). Although the sample composition of C0 and C1 are very similar, note that C0 contains older neurologically normal controls than C1, confirming that aging promotes transcriptional changes in the prefrontal cortex (D). The C1 group is formed only for samples that cannot be grouped into clusters, which the method identifies as outliers. Statistical analysis was performed using one-way ANOVA followed by Tukey post hoc test, both with significance levels of 5%.
Figure A4
Figure A4
Venn diagram comparing the target genes identified using BDASeq® and traditional pipeline using DESeq2. Note that, from the 394 target genes identified using BDASeq®, only 103 genes could be identified using DESeq2. Results also show that BDASeq® identified 291 novel target genes not identified using traditional approach.
Figure A5
Figure A5
Heatmap showing that 149 of the 394 target genes identified by BDASeq are involved in aging signatures of the brain, muscle, retina, bone marrow, and immunological system, supporting the argument that HD exacerbates aging process. Results obtained using data from the Enrichr web service.
Figure A6
Figure A6
Heatmap showing that 391 of the 394 target genes identified by BDASeq are encoded by different brain areas committed by HD. As expected, most of these genes are encoded in a prefrontal cortex, corresponding to the sequenced area. However, a part of these target genes is deregulated in the striatum (primary committed site by the mHTT-related neurodegeneration), cingulate cortex, and caudate nucleus. Results were obtained using data from the Enrichr web service.
Figure 1
Figure 1
Schematic model of the BDASeq® tool. High-throughput sequencing files/data (FASTQ) are imported into the tool using the SRA Toolkit. To minimize case–control bias, control samples are selected using the Propensity Score Matching (PSM) algorithm. Pre-selected BioSamples from controls and cases are then subjected to quality control analysis using FastQC. Samples that pass quality control are aligned to a reference genome using the STAR aligner and mapped reads are quantified using the featureCounts, generating a count matrix that serves as the input to the next step—differential expression analysis. In the differential expression analysis phase, eight different methods (DESeq2, edgeR, limma-Voom, NOISeq, EBSeq, dearseq, Wilcoxon, and Firth logistic regression) are applied individually. Results are then combined using the disruptive Recursive Method Combination (RMC) algorithm, which simultaneously reduces type I and type II errors, thus minimizing analytical bias. The process also filters out undesired samples through outlier-detection techniques. Following this integrative analysis, genes are classified into six categories: zero-count genes (ZCGs), low-count genes (LCGs), equally expressed genes (EEGs), non-relevant genes (NRGs), up- (URGs) or downregulated genes (DRGs). Finally, in the target gene search layer, artificial intelligence (AI) algorithms are employed to both identify putative target as well as retrieve URGs and DRGs associated with clinical–pathological features of interest (based on the sample metadata variables). BDASeq® is proprietary intellectual property of BioDecision Analytics Ltd., registered in Brazilian National Institute of Industrial Property (INPI, Rio de Janeiro, Brazil, BR512025001097-4).
Figure 2
Figure 2
Schematic illustration of the study design. Eligible brain (Broadmann areas (BAs) 4 and 9) and blood BioSamples (FASTQ files) from HD-positive (cases) and neurologically normal controls were downloaded from the SRA database (implemented into BDASeq®). Using BDASeq®, FASTQ files are processed, being submitted to quality control analysis, sequence alignment/mapping, and read counts. Next, read counts are subjected to differential expression analysis using the RMC algorithm. Differentially expressed genes are combined with clinical–pathological features to identify potential therapeutic targets or biomarkers using AI.
Figure 3
Figure 3
Age distribution after PSM-based sample selection (A). Note that the PSM appropriately selects 146 control samples with age distribution (age-matched controls, 59.1 ± 12.3 years) statistically similar to cases (Huntington disease, 57.9 ± 10.9 years) (B), excluding 61 unmatched control samples from older neurologically normal individuals (80.8 ± 14.4 years). Statistical analysis was performed using one-way ANOVA, followed by the Tukey post hoc test, both with significance levels of 5%.
Figure 4
Figure 4
Waterfall plot showing the total number of differentially expressed genes identified in the prefrontal and motor cortex of HD gene-positive individuals in relation to the controls. Note that, from the 62,703 transcripts encoded by the human reference genome, 36,538 (4005 ZCGs and 32,533 LCGs) transcripts are not expressed by the selected brain areas. Fron the expressed genes, 12,901 are equally expressed by cases and controls (EEGs); 7430 transcripts show a statistically significant adjusted p-value (FDR), but with no significant log2FC (NGR); and 5834 transcripts are differentially expressed between cases and control. Of these, 3729 are upregulated (URG), and 2105 are downregulated (DRG).
Figure 5
Figure 5
Comparative analysis between BDASeq® and the traditional approach using DESeq2 and the commonly used log2FC criteria for target selection. Venn diagram comparing the protein-coding genes (potential drug targets and/or biomarkers) identified by BDASeq and the traditional approach. Results show that BDASeq® identified 2057 URGs and DRGs in common with the traditional approach but identified 839 potential targets not identified by the traditional approach. Besides this, BDASeq® excludes 320 potential targets identified by the traditional approach (putative false positive targets) (A). The Sankey diagram shows that by appropriately selecting age-matched control samples with cases and combining eight different DEA techniques using the innovative RMC algorithm, BDASeq® reclassifies the gene status of the traditional approach (B).
Figure 6
Figure 6
Volcano plot showing the downregulated (DRG, in red) and upregulated (URG, in blue) identified by the RMC algorithm, as well as the putative target protein-coding genes (394) identified in prefrontal and motor cortex of HD-positive individuals using the AI-based feature selection algorithm from these DRGs and URGs.
Figure 7
Figure 7
Heatmap showing the normalized counts from the 394 protein-coding genes potentially identified as targets by BDASeq®. Results confirm that these genes are differentially expressed in prefrontal and motor cortex from HD-positive individuals when compared to the prefrontal cortex of neurologically normal controls.
Figure 8
Figure 8
Functional enrichment analysis per overrepresentation (ORA) of the 394 target genes identified by BDASeq®. Results show that the target genes positive (in blue) and negative (in red) regulate biological pathways involved in HD pathophysiology, being related to metal ion response, inflammation, behavior, negative regulation of the cell cycle, transport across the brain–blood barrier (BBB), loss of membrane scaffold, axon guidance, neurotransmission, and cholesterol metabolism. Results obtained in terms of Gene Ontology (GO), using the Erichr webservice.
Figure 9
Figure 9
Relevant clinical–pathological features identified using the BDASeq®. Results show a negative correlation between the CAG repeat length and the onset (A) and death age (B), as well as a positive correlation between the onset and death age (C). Doted line describe linear regression.
Figure 10
Figure 10
Analysis of the 12 CAG-related target genes showing that, from these genes, five are downregulated and seven are upregulated. Circle diameter indicates the number of pathways in which each gene is involved. The comparison is made considering both superior and inferior extremes of CAG distribution across HD-positive cases.
Figure 11
Figure 11
Analysis of the 59 onset age-related target genes showing that, from these genes, 33 are downregulated and 26 are upregulated. Cycle diameter indicates the number of pathways in which each gene is involved. Early onset considered onset age < 35 years whereas late onset considered onset age > 50 years.
Figure 12
Figure 12
Analysis of brain degeneration based on the Vonsattel grade. Results show that the higher the Vonsattel grade and, therefore, the brain degeneration, the shorter the onset (A) and death age (B), but the higher the CAG repeat length (C). Results were obtained using BDASeq®. Statistical analysis was performed using ANOVA, with a significant level of 5%.
Figure 13
Figure 13
Analysis of the 84 brain degeneration-related target genes showing that, from these genes, 47 are downregulated and 37 are upregulated. Circle diameter indicates the number of pathways in which each gene is involved. In this comparison we used both lower level of degeneration vs. higher level of degeneration (Vonsattel scale 4 vs. 2).
Figure 14
Figure 14
Analysis of the 16 life expectancy-related target genes showing that, from these genes, 13 are downregulated and 3 are upregulated. Circle diameter indicates the number of pathways in which each gene is involved.
Figure 15
Figure 15
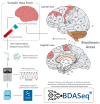
Venn diagram showing that, from the 394 HD targets identified in the prefrontal and motor cortex of HD gene-positive individuals (A), only FTH1 was found downregulated (in a CAG-dependent manner) (B) in the brain and upregulated in the blood (C).

Similar articles

Cited by

References

    1. Medina A., Mahjoub Y., Shaver L., Pringsheim T. Prevalence and Incidence of Huntington’s Disease: An Updated Systematic Review and Meta-Analysis. Mov. Disord. 2022;37:2327–2335. doi: 10.1002/mds.29228. - DOI - PMC - PubMed
    1. Jurcau A., Jurcau C. Mitochondria in Huntington’s Disease: Implications in Pathogenesis and Mitochondrial-Targeted Therapeutic Strategies. Neural Regen. Res. 2023;18:1472. doi: 10.4103/1673-5374.360289. - DOI - PMC - PubMed
    1. Harper P.S. The Epidemiology of Huntington’s Disease. Hum. Genet. 1992;89:365–376. doi: 10.1007/BF00194305. - DOI - PubMed
    1. Bhattacharyya K. The Story of George Huntington and His Disease. Ann. Indian Acad. Neurol. 2016;19:25. doi: 10.4103/0972-2327.175425. - DOI - PMC - PubMed
    1. Macdonald M. A Novel Gene Containing a Trinucleotide Repeat That Is Expanded and Unstable on Huntington’s Disease Chromosomes. Cell. 1993;72:971–983. doi: 10.1016/0092-8674(93)90585-E. - DOI - PubMed

LinkOut - more resources