. 2025 Jun 29;14(13):992.
doi: 10.3390/cells14130992.

Kisspeptin Administration and mRNA Expression in Adult Syrian Hamsters

Affiliations

Kisspeptin Administration and mRNA Expression in Adult Syrian Hamsters

Megan A L Hall et al. Cells. .

Abstract

Kisspeptin (Kiss1) and kisspeptin 1 receptor (Kiss1R) are vital in regulating various functions across many species, primarily those relating to reproduction. The kisspeptin system has recently attracted clinical interest as a potential therapeutic treatment for patients with hypoactive sexual desire disorder. This study maps the distribution of Kiss1 and Kiss1R mRNA in the Syrian hamster forebrain using dual-labeled RNAscope. In our study, the distributions of kisspeptin and its receptor were mapped across adult males and females on day 1 or day 2 of their estrous cycle. Conditioned place preference was used to observe the potential effect of kisspeptin on sexual reward in female hamsters. The expression of kisspeptin was greater in females than males, with the estrous cycle having no effect on expression. A comparison of these findings to those in other species revealed that the expression in Syrian hamsters was similar to that reported for other species, demonstrating the conservation of expression. Kisspeptin did not influence sexual reward in females, nor did it affect measures of their primary sexual behavior. These findings provide additional insights into the expression and function of kisspeptin across novel species and add to ongoing research in understanding how kisspeptin may influence sexual desire in animals, including humans.

Keywords: CNS distribution; Syrian hamster; estrous cycle; in situ hybridization; kisspeptin; kisspeptin receptor.


Conflict of interest statement

The authors declare that the research was conducted in the absence of any commercial or financial relationships that could be construed as a potential conflict of interest.

Figures

Figure 1
Figure 1
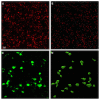
DAPI (blue) colocalization with Kiss1R mRNA puncta (red), as seen in Imaris prior to applying the Spots model. The scale bar is 500 µM.
Figure 2
Figure 2
(A) The raw image of mRNA puncta is pictured on the left. (B) The Spots model on the right demonstrates the one-to-one count of puncta in red that met the parameters described, while the puncta in white did not meet the parameters, so were not counted. (C) The raw image of Kiss1 mRNA clusters is pictured on the left. (D) The Surface model on the right illustrates the one-to-one count of mRNA clustering in cells that met the parameters described. The scale bar of 20 µM presented in (A) is consistent across the images.
Figure 3
Figure 3
Kisspeptin mRNA expression in the ARC (left) and AVPV (right) for males and day 1 as well as day 2 females. The schematic in the top left of each set illustrates the region imaged. The fluorescent image in the bottom left of each set is kisspeptin expression in the ARC or AVPV taken on the confocal apparatus and used for Imaris. For the bar graph, the bars indicate the average number of cells that express kisspeptin mRNA across males, day 1 females, and day 2 females. Neither sex nor the estrous cycle had any significant effects on the ARC. There is a significant difference in expression between day 1 females (p < 0.05) and day 2 females (p < 0.05) when compared to males in the AVPV (* indicates p < 0.05). The scale bar is 20 µM.
Figure 4
Figure 4
Kisspeptin mRNA puncta per cell for the ARC and AVPV. Cycle had no significant effect on the number of puncta expressed per cell in the ARC (F (2, 17) = 0.06910, p > 0.05), nor in the AVPV (F (2, 19) = 3.070, p > 0.05).
Figure 5
Figure 5
Kisspeptin receptor mRNA expression in the PFC and BNST for males and day 1 as well as day 2 females. The schematic in the top left illustrates the imaged region. The image in the bottom left is the expression of kisspeptin receptor 1 mRNA. In the graph, the bars indicate the average number of kisspeptin mRNA puncta for the region per group. For the PFC: F (2, 16) = 0.3112, p > 0.05; BNST: F (2, 20) = 0.3143, p > 0.05. The scale bar is 20 µM.
Figure 6
Figure 6
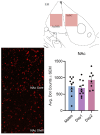
Kisspeptin receptor mRNA expression in the NAc core and shell for males and day 1 as well as day 2 females. The schematic at the top illustrates the imaged region. The images to the left are the expression of kisspeptin receptor 1 mRNA. In the graph, the bars indicate the average number of kisspeptin mRNA puncta for the region (shell and core combined) per group. For the NAc, F (2, 26) = 2.220, p > 0.05. The scale bar is 20 µM.
Figure 7
Figure 7
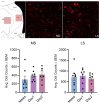
Kisspeptin receptor mRNA expression in the MS and LS for males and day 1 as well as day 2 females. The schematic in the top left illustrates the regions imaged. The images in the top right show the expression of kisspeptin receptor 1 mRNA. In the graph, the bars indicate the average number of kisspeptin mRNA puncta for the region per group. For the MS, F (2, 20) = 0.8977, p > 0.05; LS: F (2, 20) = 0.2325, p > 0.05. The scale bar is 20 µM.
Figure 8
Figure 8
Kisspeptin receptor mRNA expression in the LHb, MPOA, and MeAMG for males and day 1 as well as day 2 females. The schematic in the top left of each set illustrates the imaged region. The image in the bottom left is the expression of kisspeptin receptor 1 mRNA. In the graph, the bars indicate the average number of kisspeptin mRNA puncta for the region per group. For the LHb, F (2, 20) = 0.2307, p > 0.05; MPOA: F (2, 21) = 0.4299, p > 0.05; and MeAMG: F (2, 19) = 0.3197, p > 0.05. The scale bar is 20 µM.
Figure 9
Figure 9
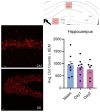
Kisspeptin receptor mRNA expression in the CA1 and DG of the hippocampus combined for males and day 1 as well as day 2 females. The schematic at the top illustrates the region imaged. The images to the left show the expression of kisspeptin receptor 1 mRNA. In the graph, the bars indicate the average number of kisspeptin mRNA puncta for the region (CA1 and DG combined) per group. For the hippocampus, F (2, 19) = 0.3528, p > 0.05. The scale bar is 20 µM.
Figure 10
Figure 10
Kisspeptin receptor mRNA expression in the AH, LH, and PVN for males and day 1 as well as day 2 females. The schematic in the top left illustrates the region imaged. The images in the top right show the expression of kisspeptin receptor 1 mRNA. In the graph, the bars indicate the average number of kisspeptin mRNA puncta for the region per group. For the AH, F (2, 17) = 0.3615, p > 0.05; LH: F (2, 17) = 0.9796, p > 0.05; and PVN: F (2, 17) = 0.6025, p > 0.05. The scale bar is 20 µM.
Figure 11
Figure 11
Kisspeptin receptor mRNA expression in the PH, DMH, and VMH for males and day 1 as well as day 2 females. The schematic in the top left illustrates the region imaged. The images in the top right show the expression of kisspeptin receptor 1 mRNA. In the graph, the bars indicate the average number of kisspeptin mRNA puncta for the region per group. For the PH, F (2, 18) = 0.3324, p > 0.05; DMH: F (2, 18) = 0.2315, p > 0.05; and VMH: F (2, 18) = 0.5356, p > 0.05. The scale bar is 20 µM.
Figure 12
Figure 12
(A) Lordosis latency and (B) lordosis duration. Bars indicate the average time it took for subjects to enter lordosis for each group. Blue bars indicate subjects that received saline. Purple bars indicate subjects that received 1 µM of kisspeptin-10. Green bars indicate subjects that received 10 µM of kisspeptin-10. The darker-shaded bars indicate the first conditioning session, and the lighter-colored bars indicate the second conditioning session.
Figure 13
Figure 13
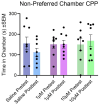
Pre- and post-test comparison of time spent in the non-preferred chamber after two sessions of CPP. Blue bars indicate subjects that received saline. Purple bars indicate subjects that received 1 µM of kisspeptin-10. Green bars indicate subjects that received 10 µM of kisspeptin-10. The darker bars indicate the pre-test session, and the lighter bars indicate the post-test session.

Similar articles

References

    1. Navarro V.M. Metabolic regulation of kisspeptin—The link between energy balance and reproduction. Nature reviews. Endocrinology. 2020;16:407–420. doi: 10.1038/s41574-020-0363-7. - DOI - PMC - PubMed
    1. Clarkson J., d’Anglemont de Tassigny X., Colledge W.H., Caraty A., Herbison A.E. Distribution of kisspeptin neurones in the adult female mouse brain. J. Neuroendocrinol. 2009;21:673–682. doi: 10.1111/j.1365-2826.2009.01892.x. - DOI - PubMed
    1. Xu Z., Kaga S., Mochiduki A., Tsubomizu J., Adachi S., Sakai T., Inoue K., Adachi A.A. Immunocytochemical localization of kisspeptin neurons in the rat forebrain with special reference to sexual dimorphism and interaction with GnRH neurons. Endocr. J. 2012;59:161–171. doi: 10.1507/endocrj.EJ11-0193. - DOI - PubMed
    1. Adekunbi D.A., Li X.F., Lass G., Shetty K., Adegoke O.A., Yeo S.H., Colledge W.H., Lightman S.L., O’Byrne K.T. Kisspeptin neurones in the posterodorsal medial amygdala modulate sexual partner preference and anxiety in male mice. J. Neuroendocrinol. 2018;30:e12572. doi: 10.1111/jne.12572. - DOI - PMC - PubMed
    1. Cravo R.M., Margatho L.O., Osborne-Lawrence S., Donato J., Jr., Atkin S., Bookout A.L., Rovinsky S., Frazão R., Lee C.E., Gautron L., et al. Characterization of Kiss1 neurons using transgenic mouse models. Neuroscience. 2011;173:37–56. doi: 10.1016/j.neuroscience.2010.11.022. - DOI - PMC - PubMed

LinkOut - more resources