. 2025 Jun 29;14(13):993.
doi: 10.3390/cells14130993.

The Cholesterol Biosynthesis Pathway Plays an Important Role in Chemotherapeutic Drug Response and Metastasis in High-Grade Osteosarcoma

Affiliations

The Cholesterol Biosynthesis Pathway Plays an Important Role in Chemotherapeutic Drug Response and Metastasis in High-Grade Osteosarcoma

Amonnat Sukhamwang et al. Cells. .

Abstract

High-grade osteosarcoma (HGOS) is the most common primary malignant bone tumor in children and adolescents. Poor response to chemotherapy is linked to worse prognosis and increased risk of recurrence and metastasis. However, current assessment methods, such as tumor necrosis evaluation, are time-consuming and delay treatment decisions. Thus, identifying molecular pathways and predictive biomarkers is essential for guiding early therapeutic strategies. In this study, RNA-seq analysis of HGOS tissues revealed enrichment of cholesterol biosynthesis and mitotic pathways in poor responders. Additionally, high HMGCR expression, as analyzed from TCGA data, was associated with poor prognosis in sarcoma. Functional validation using SaOS-2 cells, which exhibited poor drug sensitivity and elevated HMGCR levels, demonstrated that simvastatin enhanced the efficacy of cisplatin and doxorubicin by inducing mitochondrial-mediated apoptosis and downregulating anti-apoptotic proteins. Simvastatin also reduced cell migration and invasion by suppressing epithelial-mesenchymal transition and extracellular matrix degradation. Mechanistically, simvastatin disrupted Ras prenylation and inhibited downstream oncogenic signaling pathways, including Akt/mTOR and Akt/GSK3, which regulate survival and metastasis-associated gene expression. These findings suggest that the cholesterol biosynthesis pathway particularly plays a critical role in chemoresistance and metastasis in HGOS and may serve as a promising predictive molecular target for guiding early therapeutic strategies.

Keywords: RNA-seq; cholesterol biosynthesis; drug resistance; osteosarcoma; transcriptomics.


Conflict of interest statement

The authors declare no conflicts of interest. The funders had no role in the design of the study; in the collection, analyses, or interpretation of the data; in the writing of the manuscript; or in the decision to publish the results.

Figures

Figure 1
Figure 1
(A) Volcano diagram displaying the DEGs between OS samples with good versus poor response to chemotherapy. The diagram highlights 621 upregulated and 423 downregulated genes, with each point representing a gene’s magnitude and significance of differential expression. (B) Validation of the RNA sequencing data was performed using RT qPCR to confirm the expression levels of key DEGs, ensuring the accuracy of the bioinformatics analysis.
Figure 2
Figure 2
Transcriptomic profiling of drug response-associated pathways in osteosarcoma. (A) This panel presented the GO enrichment analysis of the differentially expressed genes (DEGs). It highlighted key biological processes, molecular functions, and cellular compartment associated with drug response in osteosarcoma. (B) REACTOME pathway enrichment analysis of DEGs. (C) Protein–protein interaction (PPI) network visualized using Cytoscape, where nodes are color-coded by fold-change levels (darker violet indicates higher fold-changes). (D) Hub genes obtained from the PPI network were identified using MCODE, showing the most significant module (MCODE score = 11.42). (E) Functional enrichment and pathway analysis of the hub genes in panel (D) were visualized using ClueGO. (F) The second significant module identified by MCODE (MCODE score = 6.0). (G) Functional enrichment and pathway analysis of the hub genes in panel (F) were visualized using ClueGO.
Figure 3
Figure 3
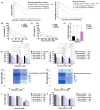
Evaluation of the cholesterol biosynthesis pathway in modulating chemotherapeutic response in osteosarcoma cells. (A) Kaplan–Meier curves showing overall survival and disease-specific survival of sarcoma patients stratified by HMGCR expression, analyzed using cBioPortal. (B) Cell viability of OS cell lines after cisplatin treatment for 72 h was assessed using the MTT assay. (C) Cell viability of OS cell lines after doxorubicin treatment for 72 h was assessed using the MTT assay. (D) Expression of the HMGCR gene in OS cell lines was evaluated using RT-qPCR. Effect of simvastatin in combination with cisplatin (E) or doxorubicin (F) on SaOS-2 cell viability, as determined by MTT assay. (G) The Heatmap with CI values of a combination between cisplatin and simvastatin in SaOS-2 cells. (H) The Heatmap with CI values of a combination between doxorubicin and simvastatin in SaOS-2 cells. A CI value of < 0.80 indicates synergism, 0.80–1.20 indicates an additive effect, and > 1.20 indicates antagonism. Effect of simvastatin in combination with cisplatin (I) or doxorubicin (J) on 143B cell viability. All experiments were repeated at least three times. * p < 0.05, ** p < 0.01, and *** p < 0.001 compared to the control group.
Figure 4
Figure 4
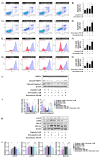
The effect of inhibiting cholesterol biosynthesis on apoptotic alterations in SaOS-2 cells. (A) SaOS-2 cells were treated with 5 μM cisplatin with or without 3 μM simvastatin for 48 h. Apoptosis was assessed using Annexin V-FITC/PI staining followed by flow cytometry. (B) Data are presented as a bar graph. (C) SaOS-2 cells were treated with 150 nM doxorubicin with or without 3 μM simvastatin for 48 h and apoptosis was analyzed. (D) Data are presented as a bar graph. (E) MMP changes after combination treatment with 5 μM cisplatin and 3 μM simvastatin were assessed using MitoView™ staining and flow cytometry was used for analysis. (F) Data are presented as a bar graph. (G) MMP changes following combination treatment of 150 nM doxorubicin and 3 μM simvastatin for 48 h were analyzed similarly. (H) Data are presented as a bar graph. (I) Western blot analysis of cleaved PARP-1 and caspase-3 levels in SaOS-2 cells treated with simvastatin in combination with either cisplatin or doxorubicin for 36 h. (J) Data are presented as a bar graph. (K) Expression of anti-apoptotic proteins (BCL-2, BCL-XL, c-FLIP, and c-IAP2) was evaluated under the same conditions. (L) Data are presented as a bar graph. * p < 0.05, ** p < 0.01, and *** p < 0.001 (compared within experimental groups). # p < 0.05, ## p < 0.01, and ### p < 0.001 (compared to control group). All data are representative of three independent experiments as mean ± SD.
Figure 5
Figure 5
Role of cholesterol biosynthesis pathway in SaOS-2 cells migration and invasion. (A) PCA score plot showing the association between the expression of cholesterol and steroid biosynthesis-related genes and metastasis status in OS tissues. (B) Boyden chamber assay was performed to detect the migration of SaOS-2 after treatment with simvastatin for 18 h (10× magnifications). (C) Quantification of migrated cells represented as a bar graph. (D) The effects of simvastatin on SaOS-2 cell invasion were evaluated by using Boyden camber assay after treatment with simvastatin for 18 h (10× magnifications). (E) Quantification of invaded cells are represented as a bar graph. (F) Western blot analysis of epithelial–mesenchymal transition (EMT)-related protein expression in SaOS-2 cells following 24 h simvastatin treatment. (G) Densitometric quantification of EMT protein bands using ImageJ, presented as histograms. (H) Western blot analysis of extracellular matrix (ECM)-degrading enzyme expression in SaOS-2 cells after 24 h of simvastatin exposure. (I) Quantification of ECM-related protein band intensity using ImageJ, presented as a histogram. Results were mean ± S.D. of three independent experiments. * p < 0.05, ** p < 0.01, *** p < 0.001 compared to control. All data are representative of three independent experiments as mean ± SD.
Figure 6
Figure 6
The role of cholesterol biosynthesis pathway on the modulation of oncogenic signaling. (A) Effect of simvastatin on cytosolic Ras, after being treated with simvastatin for 24 h. (B) Band density was quantified using ImageJ and presented as a histogram. (C) Effect of simvastatin on expression levels of phosphorylated and non-phosphorylated forms of cellular Akt, mTOR, and GSK3 signaling proteins, after being treated with simvastatin for 24 h. (D) Band density was quantified using ImageJ and presented as a histogram. The Western blot results are representative of three independent experiments. Effect of cholesterol levels on SaOS-2 cell viability during treatment with cisplatin (E) or doxorubicin (F). Exogenous cholesterol was added to cells co-treated with cisplatin and simvastatin or doxorubicin and simvastatin. Cell viability was assessed using MTT assay. All experiments were performed in triplicate. * p < 0.05, ** p < 0.01, and *** p < 0.001 (compared within experimental groups). # p < 0.05, ## p < 0.01, and ### p < 0.001 (compared to control group).

Similar articles

References

    1. Ottaviani G., Jaffe N. The epidemiology of osteosarcoma. Pediatr. Adolesc. Osteosarcoma. 2009;152:3–13. - PubMed
    1. Sever N., Şimşek F., Onur İ.D., Arvas H., Guliyev T., Şakalar T., Çiçek C.M., Orman S., Çetin E.B., Kayaş K., et al. Prognostic Factors in High Grade Osteosarcoma Patients Who Received Neoadjuvant Therapy and Subsequently Underwent Surgery: Data from the Turkish Oncology Group. J. Clin. Med. 2025;14:2024. doi: 10.3390/jcm14062024. - DOI - PMC - PubMed
    1. Patel T.D., Grimm S.L., Kanchi R.S., Gandhi T., Koirala A., Yustein J.T., Coarfa C. Identification of an early survival prognostic gene signature for localized osteosarcoma patients. Sci. Rep. 2024;14:7327. doi: 10.1038/s41598-024-57527-8. - DOI - PMC - PubMed
    1. Odri G.A., Tchicaya-Bouanga J., Yoon D.J.Y., Modrowski D. Metastatic progression of osteosarcomas: A review of current knowledge of environmental versus oncogenic drivers. Cancers. 2022;14:360. doi: 10.3390/cancers14020360. - DOI - PMC - PubMed
    1. Garcia-Ortega D.Y., Cabrera-Nieto S.A., Caro-Sánchez H.S., Cruz-Ramos M. An overview of resistance to chemotherapy in osteosarcoma and future perspectives. Cancer Drug Resist. 2022;5:762. doi: 10.20517/cdr.2022.18. - DOI - PMC - PubMed

MeSH terms

LinkOut - more resources