. 2025 Jul 1;14(13):1007.
doi: 10.3390/cells14131007.

Porcine Single-Eye Retinal Pigment Epithelium Cell Culture for Barrier and Polarity Studies

Affiliations

Porcine Single-Eye Retinal Pigment Epithelium Cell Culture for Barrier and Polarity Studies

Philipp Dörschmann et al. Cells. .

Abstract

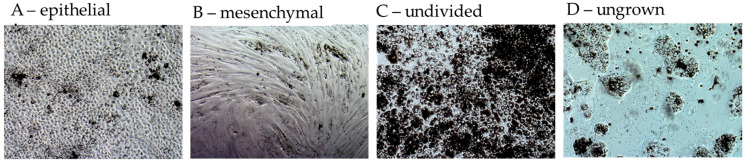
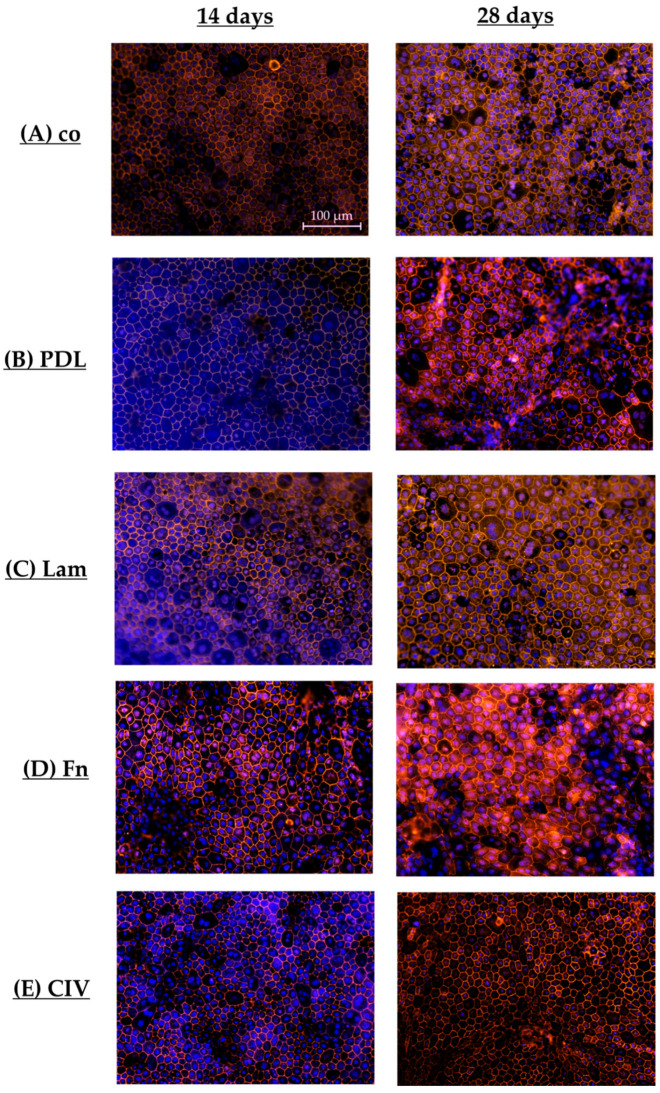
Age-related macular degeneration (AMD) is the main cause of blindness in Western nations. AMD models addressing specific pathological pathways are desired. Through this study, a best-practice protocol for polarized porcine single-eye retinal pigment epithelium (RPE) preparation for AMD-relevant models of RPE barrier and polarity is established. Single-eye porcine primary RPE cells (from one eye for one well) were prepared in 12-well plates including Transwell inserts. Different coatings (laminin (Lam), Poly-ᴅ-Lysine (PDL), fibronectin (Fn) and collagens) and varying serum contents (1%, 5% and 10%) were investigated to determine optimal culture parameters for this model. Success rates of cultures, cell number (trypan-blue exclusion assay), morphology/morphometry (light and fluorescence microscopy), protein secretion/expression (ELISA, Western blot), gene expression (qPCR), transepithelial electric resistance (TEER) and polar location of bestrophin 1 (BEST1) by cryosectioning (IHC-Fr) were assessed. Cells seeded on Lam exhibited the highest level of epithelial cells and confluence properties. Fn resulted in the highest cell number growth. Lam and Fn exhibited the highest culture success rates. TEER values and vascular endothelial growth factor secretion were highest when Lam was used. For the first time, polar (Transwell) porcine single-eye RPE morphometry parameters were determined. RPE on Lam showed bigger cells with a higher variety of cell shapes. CIV displayed the lowest claudin 19 expression. The highest basolateral expression of BEST1 was achieved with Lam coating. The higher the serum, the better the cell number increase and confluence success. A reduction in serum on Lam showed positive results for RPE morphology, while morphometry remained stable. A five percent serum on Lam showed the highest culture success rate and best barrier properties. RPE65 expression was reduced by using 10% serum. Altogether, the most suitable coating of Transwell inserts was Lam, and a reduction in serum to 5% is recommended, as well as a cultivation time of 28 days. A protocol for the use of polar porcine single-eye cultures with validated parameters was established and is provided herein.

Keywords: 3R principle; Transwell; age-related macular degeneration; barrier; best practice protocol; polarity; primary cell culture; retinal pigment epithelium; single-eye culture; tight junctions.


Conflict of interest statement

The authors declare no conflicts of interest. The funders had no role in the design of the study; in the collection, analyses, or interpretation of data; in the writing of the manuscript; or in the decision to publish the results.

Figures

Figure 1
Figure 1
Flowchart of experimental schedule. The aim of this study is to provide a model system for polar porcine retinal pigment epithelium single-eye cultures (yellow). Cells of individual pig eyes are seeded into different wells of a 12-well plate with a Transwell insert generating genetic homogenous polar cultures per well. Coating and serum contents of the media were compared (light red). The conducted biological tests are listed (green). Typical standard preparation parameters are underlined and are used as reference controls for this study. RPE = retinal pigment epithelium.
Figure 2
Figure 2
Polar single-eye RPE preparation from porcine eyes. (A) Cleaning eyes from adjacent tissue, (B) storing eyes in cold NaCl, (C) opening eyes and removing vitreous body and retina, (D) trypsinization of eyes, (E) washing and centrifugation, and (F) seeding cells on Transwell inserts.
Figure 3
Figure 3
Example photographs of morphology. Morphological assessment was conducted with light microscopy images (5× magnification). Portions in % of the whole image of epithelial (A), mesenchymal (B), undivided (C) and ungrown cells (D) were visually determined by trained researchers.
Figure 4
Figure 4
Example images for actin filament distribution as an indication of differentiation. To make a qualitative ranking of the overall RPE morphology, actin immune fluorescence imaging was used. (A) Epithelial honeycomb-structured cells depicting highly differentiated epithelial RPEs, (B) mixed cultures with a partial transformation to a mesenchymal phenotype with stress fibers and (C) completely mesenchymal cells.
Figure 5
Figure 5
Cell number difference with different coatings. After a cultivation time of 7, 14 and 28 days, porcine single-eye retinal pigment epithelium cells were counted. They were seeded on non-coated wells (co), Poly-ᴅ-Lysine (PDL), fibronectin (Fn), laminin (Lam) or collagen IV (CIV). Change in cell number ×104/mL at respective time points is shown. Data show normal distribution, mean and standard deviation. Between each condition, significances were determined via analysis of variance (ANOVA) and Student’s t-test. * p < 0.05, ** p < 0.01. n = 7–48.
Figure 6
Figure 6
Confluence with different coatings. Porcine single-eye retinal pigment epithelium cells were cultured on non-coated wells (co), Poly-ᴅ-Lysine (PDL), fibronectin (Fn), laminin (Lam), or collagen IV (CIV). On the 7th day of cultivation, confluent cell growth area was determined by light microscopy in % of the whole well (A). In addition, day of full confluence was determined (B). Data are non-parametric; median, interquartile range and range from minimum to maximum are depicted. Between each group, significances were calculated with the Kruskal–Wallis test followed by Mann–Whitney test. * p < 0.05, ** p < 0.01, *** p < 0.001. n = 45–89.
Figure 7
Figure 7
Cell morphology on different coatings. Porcine single-eye retinal pigment epithelium cells were cultivated on non-coated wells (co), Poly-ᴅ-Lysine (PDL), fibronectin (Fn), laminin (Lam) or collagen IV (CIV). After 7 (A), 14 (B) and 28 (C) days, the portion of epithelial areas of the individual wells was analyzed with bright field imaging. Data are non-parametric; median, interquartile range and range from minimum to maximum are depicted. Between each group, significances were calculated with Kruskal–Wallis test followed by Mann–Whitney test. * p < 0.05, ** p < 0.01, *** p < 0.001. n = 18–86.
Figure 8
Figure 8
VEGF secretion with different coatings. Porcine single-eye retinal pigment epithelium cells were cultivated on Transwell inserts coated with collagen IV (CIV), laminin (Lam), Poly-ᴅ-Lysine (PDL), fibronectin (Fn) or non-coated wells (co) for 7 (A), 14 (B) and 28 (C) days. Apical and basolateral supernatants were harvested for four hours at different cultivation times and applied in ELISA to determine vascular endothelial growth factor A (VEGF) secretion in pg per well area. Data were parametric; mean and standard deviation are depicted. Between each group, significances were first calculated with analysis of variance (ANOVA) followed by Student’s t-test. * p < 0.05, ** p < 0.01, *** p < 0.001. n = 14–19.
Figure 9
Figure 9
CLDN19 and RPE65 expression with different coatings. Porcine single-eye retinal pigment epithelium cells were cultivated on Transwell inserts coated with collagen IV (CIV), laminin (Lam), Poly-ᴅ-Lysine (PDL), fibronectin (Fn), or non-coated wells (co) for 14 (A,C) and 28 (B,D) days. Lysates were analyzed with Western blot for retinoid isomerohydrolase (RPE65, (A,B)) and claudin-19 (CLDN19, (C,D)). Example blots are shown (E). Data were parametric; mean and standard deviation are depicted. Between each group, significances were first calculated with analysis of variance (ANOVA) followed by Student’s t-test. * p < 0.05. n = 6–7.
Figure 10
Figure 10
Cell barrier with different coatings. Porcine single-eye retinal pigment epithelium cells were cultivated on Transwell inserts non-coated (co) or coated with Poly-ᴅ-Lysine (PDL), fibronectin (Fn), laminin (Lam) or collagen IV (CIV) for 7, 10, 14 and 28 days. Transepithelial electrical resistance (TEER) was measured. Data were parametric; mean and standard deviation are depicted. Between each group, significances were calculated with analysis of variance (ANOVA) followed by Student’s t-test. * p < 0.05, ** p < 0.01, *** p < 0.001. n = 9–62.
Figure 11
Figure 11
Exemplary photos. Cells used for determining morphometric parameters were stained for cell nuclei and tight junctions. Example photos for each coating condition are shown 14 and 28 days after preparation (non-coated wells (co, (A)), Poly-ᴅ-Lysine (PDL, (B)), laminin (Lam, (C)), fibronectin (Fn, (D)), or collagen IV (CIV, (E)). Objective = 20×; scale bar = 100 µm.
Figure 12
Figure 12
Bestrophin-1 localization and expression. Porcine single-eye retinal pigment epithelium cells were cultivated on Transwell inserts coated with collagen IV (CIV), laminin (Lam), Poly-ᴅ-Lysine (PDL), fibronectin (Fn), or non-coated wells (co) for 28 days. Cryosectioning of Transwell inserts was performed and stained for bestrophin-1 (BEST1) expression. Example photos for co (C) and Lam (D) are depicted (green = cell nuclei, orange = BEST1, objective = 63×; scale bar = 20 µm). Apical and basolateral expression was detected and evaluated with Fiji. Apical and basolateral fluorescence intensity normalized by fluorescence area (A) as well as relative basolateral and apical normalized fluorescence intensity (B) are shown. Data were parametric; mean and standard deviation are depicted. Between each group, significances were first calculated with analysis of variance (ANOVA) followed by Student’s t-test. * p < 0.05, ** p < 0.01, *** p < 0.001. n = 6–14.
Figure 13
Figure 13
Cell number difference depending on serum content. Porcine single-eye retinal pigment epithelium cells were counted with trypan-blue exclusion assay after 14 days of cultivation. They were seeded on laminin (Lam) or non-coated wells (co) with different serum content (1%, 5%, 10%). Cell number difference x104/mL is shown. Data show normal distribution; mean and standard deviation are depicted. Between each condition, significances were determined via analysis of variance (ANOVA) and Student’s t-test. * p < 0.05, ** p < 0.01, *** p < 0.001. n = 5–7.
Figure 14
Figure 14
Confluence depending on serum content. Porcine single-eye retinal pigment epithelium cells were cultured on laminin (Lam), or non-coated wells (co) with different serum content (1%, 5%, 10%). On the seventh day of cultivation, confluent cell growth area was determined by bright field microscopy in % of the well (A). Also, day of full confluence was determined (B). Data are non-parametric; median, interquartile range and range from minimum to maximum are depicted. Between each group, significances were calculated with Kruskal–Wallis test followed by Mann–Whitney test. No significant findings were found. n = 22–40.
Figure 15
Figure 15
Cell morphology depending on serum content. Porcine single-eye retinal pigment epithelium cells were cultured on laminin (Lam) or non-coated wells (co) with different serum contents (1%, 5%, 10%). After 7 (A), 14 (B) and 28 (C) days, the portion of epithelial areas of the individual wells was determined with bright field microscopy photos. Data are non-parametric; median, interquartile range and range from minimum to maximum are depicted. Between each group, significances were calculated with Kruskal–Wallis test followed by Mann–Whitney test. * p < 0.05, ** p < 0.01, *** p < 0.001. n = 48–54.
Figure 16
Figure 16
VEGF secretion depending on serum content. Porcine single-eye retinal pigment epithelium cells were cultured in laminin (Lam), or non-coated Transwell inserts (co) with different serum contents (1%, 5%, 10%) for 7 (A), 14 (B) and 28 (C) days. Apical and basolateral supernatants were harvested for four hours at the respective cultivation time and applied in ELISA to determine vascular endothelial growth factor A (VEGF) secretion in pg per well area. Data are parametric; mean and standard deviation are depicted. Between each group, significances were first calculated with analysis of variance (ANOVA) followed by Student’s t-test. * p < 0.05, ** p < 0.01, *** p < 0.001. n = 10–14.
Figure 17
Figure 17
RPE65 and CLDN19 expression with serum content. Porcine single-eye retinal pigment epithelium cells were cultured in laminin (Lam) or non-coated Transwell inserts (co) with different serum contents (1%, 5%, 10%) for 14 (A,C) and 28 (B,D) days. Lysates were analyzed with Western blot for retinoid isomerohydrolase (RPE65, (A,B)) and claudin-19 (CLDN19, (C,D)). Example blots are shown (E). Data are parametric; mean and standard deviation are depicted. Between each group, significances were first calculated with analysis of variance (ANOVA) followed by Student’s t-test. * p < 0.05. n = 6.
Figure 18
Figure 18
Cell barrier depending on serum content. Porcine single-eye retinal pigment epithelium cells were cultured on Transwell inserts coated with laminin (Lam), or non-coated Transwell inserts (co) with different serum contents (1%, 5%, 10%) for 7, 10, 14, and 28 days. Transepithelial electrical resistance (TEER) was measured. Data are parametric; mean and standard deviation are depicted. Significances were calculated with analysis of variance (ANOVA) followed by Student’s t-test. * p < 0.05, ** p < 0.01. n = 9–62.
Figure 19
Figure 19
Exemplary photos. Cells used for determining morphometric parameters were stained for cell nuclei and tight junctions. Example photos for each serum condition are shown 14 and 28 days after preparation (non-coated wells (co) with 10% (A), 5% (B) and 1% (C) vs. laminin (Lam) with 10% (D), 5% (E) and 1% (F)). Objective = 20×; scale bar = 100 µm.

Similar articles

References

    1. Bhutto I., Lutty G. Understanding age-related macular degeneration (AMD): Relationships between the photoreceptor/retinal pigment epithelium/Bruch’s membrane/choriocapillaris complex. Mol. Asp. Med. 2012;33:295–317. doi: 10.1016/j.mam.2012.04.005. - DOI - PMC - PubMed
    1. Strauss O. The retinal pigment epithelium in visual function. Physiol. Rev. 2005;85:845–881. doi: 10.1152/physrev.00021.2004. - DOI - PubMed
    1. Rizzolo L.J. Barrier properties of cultured retinal pigment epithelium. Exp. Eye Res. 2014;126:16–26. doi: 10.1016/j.exer.2013.12.018. - DOI - PubMed
    1. Wong W.L., Su X., Li X., Cheung C.M.G., Klein R., Cheng C.-Y., Wong T.Y. Global prevalence of age-related macular degeneration and disease burden projection for 2020 and 2040: A systematic review and meta-analysis. Lancet Glob. Health. 2014;2:e106-16. doi: 10.1016/S2214-109X(13)70145-1. - DOI - PubMed
    1. Schnichels S., Paquet-Durand F., Löscher M., Tsai T., Hurst J., Joachim S.C., Klettner A. Retina in a dish: Cell cultures, retinal explants and animal models for common diseases of the retina. Prog. Retin. Eye Res. 2021;81:100880. doi: 10.1016/j.preteyeres.2020.100880. - DOI - PubMed

LinkOut - more resources