. 2025 Jul 2;14(13):1011.
doi: 10.3390/cells14131011.

Apolipoprotein L1 (APOL1): Consideration of Molecular Evolution, Interaction with APOL3, and Impact of Splice Isoforms Advances Understanding of Cellular and Molecular Mechanisms of Cell Injury

Affiliations

Apolipoprotein L1 (APOL1): Consideration of Molecular Evolution, Interaction with APOL3, and Impact of Splice Isoforms Advances Understanding of Cellular and Molecular Mechanisms of Cell Injury

Razi Khalaila et al. Cells. .

Abstract

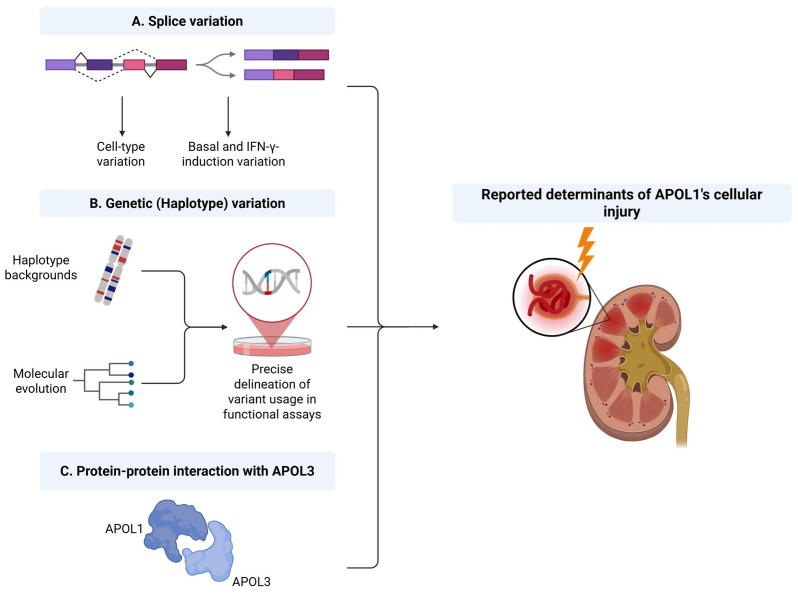
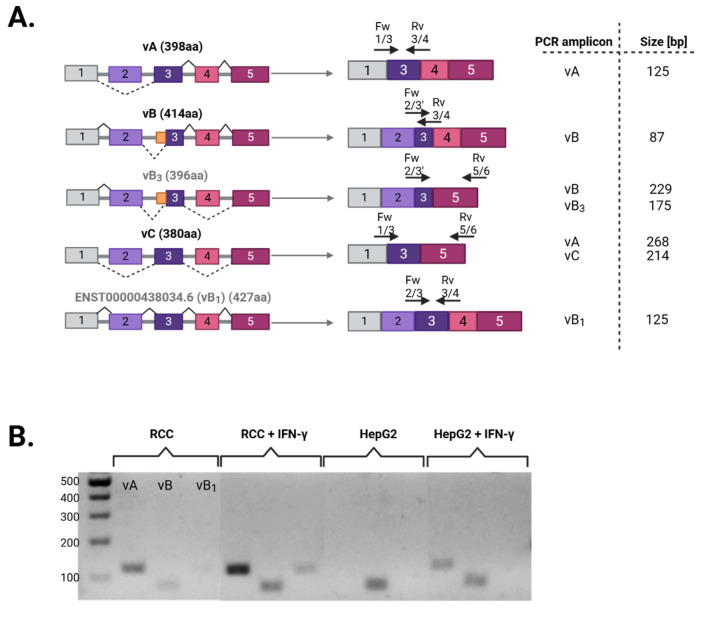
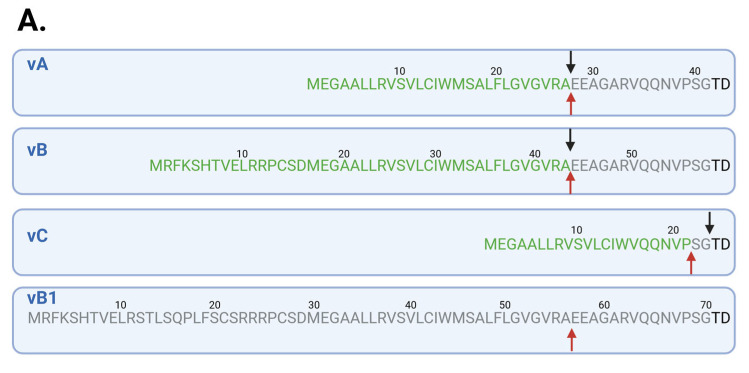
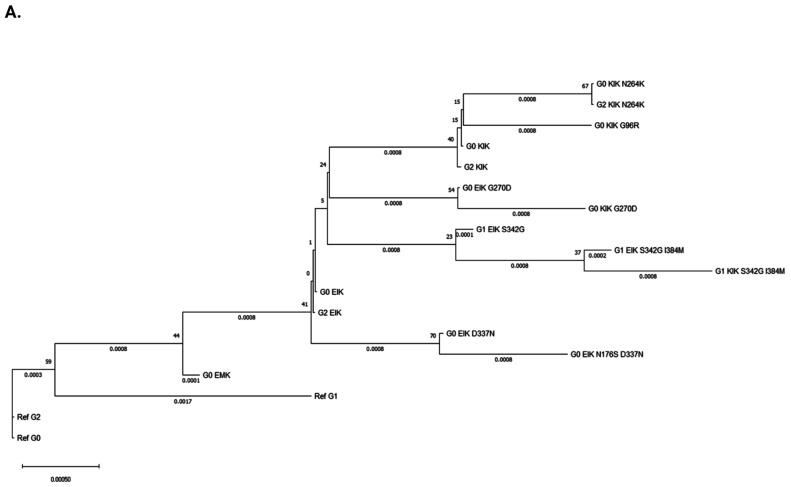
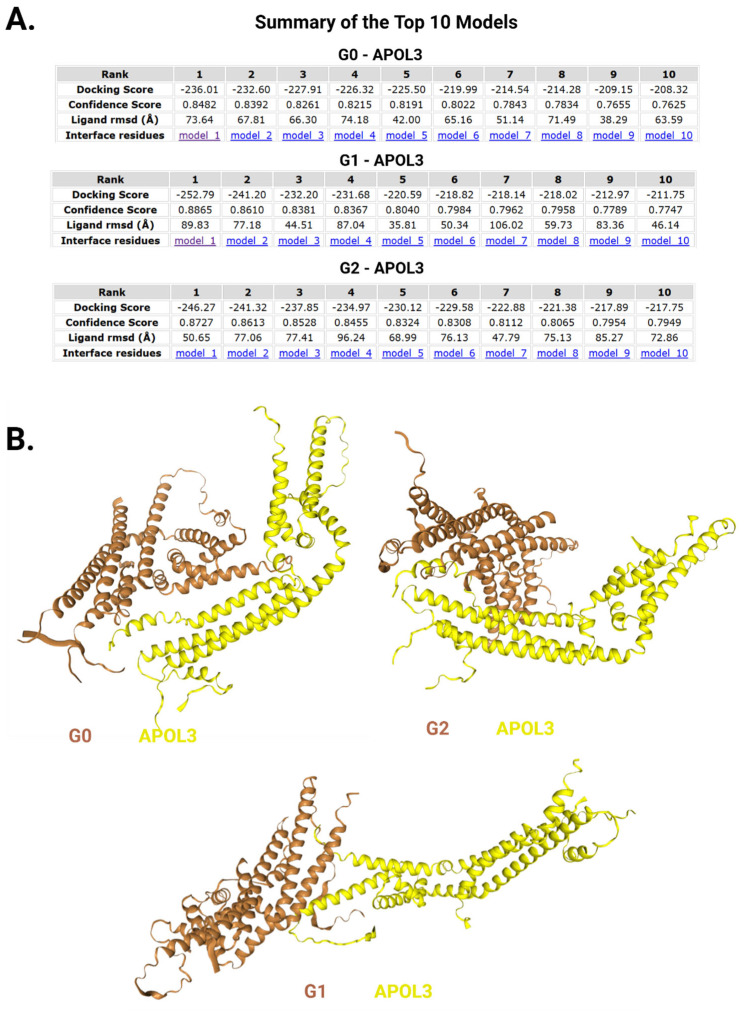
The Apolipoprotein L1 (APOL1) innate immunity gene product represents the sole member of the APOL gene family in humans capable of secretion into circulation, thereby mediating the trypanolysis of T. brucei brucei. Gain-of-function variants of the APOL1 gene originated and spread among human population groups to extend APOL1's protective capacity to include also serum-resistant subspecies, such as T. brucei gambiense (S342G known as APOL1-G1) and T. brucei rhodesiense (N388_Y389del known as APOL1-G2). The biochemical pathways underlying the lytic activity of these evolutionary favored mutations against bloodstream trypanosomes have been elucidated with remarkable precision. However, the intricate molecular mechanisms by which such variants confer an increased susceptibility to renal cellular injury and consequent kidney disease remain incompletely defined. In the absence of a consistent mechanistic explanation for differential kidney injury, we propose pursuing three interrelated avenues of investigation informed by prior epidemiological and mechanistic evidence linking them to APOL1's cytotoxicity: (1) Molecular evolution of APOL1 haplotypes in human populations, (2) APOL1 splicing and consequent splice isoforms, (3) Interaction of APOL1 with other APOL gene family members, prioritizing APOL3. In the current study, we use reanalysis of population genetics datasets to resolve the haplotype contexts of all protein-altering APOL1 variants, uncovering previously unrecognized variant-haplotype couplings. We further characterize distinct cellular physiological properties among APOL1 splice isoforms, stressing the importance of isoform vB and what can be learned from isoform vC. Finally, a native interaction, and its interface, between APOL1 and APOL3 is reported, and shown to be differentially modulated by G1 and G2. We contend that continuing studies integrating these three interrelated domains will substantially advance mechanistic insights into APOL1 variant-driven renal injury, and leverage the findings to provide a more cohesive framework to guide future research.

Keywords: APOL1 risk variants; APOL1 splice variants; APOL3; phylogenetics; protein–protein interaction; signal peptide; trypanosome lytic factor; trypanosomiasis.


Conflict of interest statement

The authors declare no conflicts of interest.

Figures

Figure 1
Figure 1
Primary aspects investigated in the study. An explicative figure depicting three domains previously reported to affect the expressivity of APOL1’s cytotoxicity: splicing, genetic variation, and protein–protein interaction with APOL3.
Figure 2
Figure 2
APOL1 splice variation in different cellular systems and under basal or induced conditions. (A) Illustration depicting putative splice variants of APOL1 (names shaded in gray are not reviewed/validated in UniProt), their final mature mRNA transcript, and the location of the exon–exon junction primers designed to delineate each splice variant. In the table to the right, the identities of the PCR amplicons and their predicted sizes are listed. Since exons 6–7 are present in all splice variants, they were omitted from the illustration. (B) Primer pairs that yield one definitive product were used to amplify their respective targets from total RNA extracted and reverse-transcribed into cDNA from RCC and HepG2 cells, with and without IFN-γ treatment. A representative agarose-gel image of the final PCR amplicons is presented, with markings above denoting the order of reactions in each segment: vA, vB, and then vB1. (C) Primer pairs that yield two amplicons of different sizes corresponding to vA and vC were used as in (B). A representative agarose-gel image of the final PCR amplicon depicts a very intense upper band (vA) and much fainter smaller band underneath (vC) following the same expression pattern. (D) A primer pair that yield two amplicons of different sizes corresponding to vB and vB3 was used as in (B,C). A representative agarose-gel image of the final PCR amplicon depicts only one intense upper band (vB) and no visible sign of vB3. Here both samples were treated with IFN-γ.
Figure 2
Figure 2
APOL1 splice variation in different cellular systems and under basal or induced conditions. (A) Illustration depicting putative splice variants of APOL1 (names shaded in gray are not reviewed/validated in UniProt), their final mature mRNA transcript, and the location of the exon–exon junction primers designed to delineate each splice variant. In the table to the right, the identities of the PCR amplicons and their predicted sizes are listed. Since exons 6–7 are present in all splice variants, they were omitted from the illustration. (B) Primer pairs that yield one definitive product were used to amplify their respective targets from total RNA extracted and reverse-transcribed into cDNA from RCC and HepG2 cells, with and without IFN-γ treatment. A representative agarose-gel image of the final PCR amplicons is presented, with markings above denoting the order of reactions in each segment: vA, vB, and then vB1. (C) Primer pairs that yield two amplicons of different sizes corresponding to vA and vC were used as in (B). A representative agarose-gel image of the final PCR amplicon depicts a very intense upper band (vA) and much fainter smaller band underneath (vC) following the same expression pattern. (D) A primer pair that yield two amplicons of different sizes corresponding to vB and vB3 was used as in (B,C). A representative agarose-gel image of the final PCR amplicon depicts only one intense upper band (vB) and no visible sign of vB3. Here both samples were treated with IFN-γ.
Figure 3
Figure 3
APOL1 isoform-dependent extracellular detection. (A) Illustration depicting the beginning of the amino acid sequence of all isoforms validated to be expressed as in Figure 2. In green is the predicted signal sequence of each isoform, only if predicted by both methods, with arrows indicating the predicted cleavage point (black arrow above by SignalP 6.0, and red arrow below by DeepTMHMM). In gray are ambiguous amino acids or those that are not shared by all isoforms, and in black are common amino acids. For isoform vB1 no signal peptide was predicted by SignalP 6.0, and only low-confidence SP was predicted by DeepTMHMM. (B) Representative ELISA results of measured APOL1 protein detection in the supernatant of HEK293 cells 24 h after transfection with a plasmid encoding the respective isoform of APOL1. Transfections were performed in duplicates, and each was coated as triplicates into ELISA plates. Welch’s one-way ANOVA with Dunnett T3 multiple comparisons test was used for statistical testing. W = 743.1400, DFn = 2.0000, DFd = 8.6120; *** and **** are both p-values < 0.0001.
Figure 3
Figure 3
APOL1 isoform-dependent extracellular detection. (A) Illustration depicting the beginning of the amino acid sequence of all isoforms validated to be expressed as in Figure 2. In green is the predicted signal sequence of each isoform, only if predicted by both methods, with arrows indicating the predicted cleavage point (black arrow above by SignalP 6.0, and red arrow below by DeepTMHMM). In gray are ambiguous amino acids or those that are not shared by all isoforms, and in black are common amino acids. For isoform vB1 no signal peptide was predicted by SignalP 6.0, and only low-confidence SP was predicted by DeepTMHMM. (B) Representative ELISA results of measured APOL1 protein detection in the supernatant of HEK293 cells 24 h after transfection with a plasmid encoding the respective isoform of APOL1. Transfections were performed in duplicates, and each was coated as triplicates into ELISA plates. Welch’s one-way ANOVA with Dunnett T3 multiple comparisons test was used for statistical testing. W = 743.1400, DFn = 2.0000, DFd = 8.6120; *** and **** are both p-values < 0.0001.
Figure 4
Figure 4
Phylogenetic analysis of APOL1 variants and haplotypes. Phylogenetic tree constructed using all 18 sequences presented in Table 2 and inferred by the maximum likelihood (ML) method, with Kimura 2-parameter model used for substitution and Nearest Neighbor Interchange (NNI) as the ML heuristic method. Bootstrap values of 500 replications is depicted in front of each node. Analysis was conducted in MEGA11 [81], either by (A) fixing the reference G0 sequence as an outgroup, or (B) without a fixed outgroup.
Figure 4
Figure 4
Phylogenetic analysis of APOL1 variants and haplotypes. Phylogenetic tree constructed using all 18 sequences presented in Table 2 and inferred by the maximum likelihood (ML) method, with Kimura 2-parameter model used for substitution and Nearest Neighbor Interchange (NNI) as the ML heuristic method. Bootstrap values of 500 replications is depicted in front of each node. Analysis was conducted in MEGA11 [81], either by (A) fixing the reference G0 sequence as an outgroup, or (B) without a fixed outgroup.
Figure 5
Figure 5
Positive selection analysis of APOL1 variants. (A) Tajima’s neutrality test involving all 18 nucleotide sequences of APOL1 variants presented in Table 2. Codon positions included were 1st+2nd+3rd. All ambiguous positions were removed for each sequence pair (pairwise deletion option). There were a total of 1194 positions in the final data set. Evolutionary analyses were conducted in MEGA11 [81]. Abbreviations m = number of sequences, n = total number of sites, S = Number of segregating sites, Ps = S/n, θ = ps/a1, π = nucleotide diversity, and D is the Tajima test statistic. (B) SLAC analysis using a maximum likelihood ancestral state reconstruction and minimum path substitution counting. The test applied a simple binomial-based test of whether dS differs from dN. The estimates aggregate information over all branches, so the signal is derived from pervasive diversification or conservation. Amino acid positions of SNPs showing strong positive selection signal (i.e., high dN-dS) are denoted above each column. (C) BUSTED analysis using a random effects branch-site model fitted jointly to all or a subset of tree branches for alignment-wide evidence of episodic diversifying selection. Since an omega > 1 was observed, individual sites were subjected to evidence-ratio style analysis to explore which ones may have been subject to selection. ER ratio values are presented on the y-axis, and sites (amino acid position on the x-axis) above the threshold (blue line) are highlighted by red circles. (D) Codon-based test of positive selection for analysis between sequences. The probability of rejecting the null hypothesis of strict neutrality (dN = dS) in favor of the alternative hypothesis (dN > dS) (below diagonal) is shown. Values of p less than 0.05 are considered significant at the 5% level and are highlighted in yellow. The test statistic (dN-dS) is shown above the diagonal. dS and dN are the numbers of synonymous and nonsynonymous substitutions per site, respectively. The variance of the difference was computed using the analytical method. Analyses were conducted using the Nei–Gojobori method. This analysis involved all 18 nucleotide sequences of APOL1 variants presented in Table 2. All ambiguous positions were removed for each sequence pair (pairwise deletion option). There were a total of 398 positions in the final dataset. Evolutionary analyses were conducted in MEGA11 [81].
Figure 5
Figure 5
Positive selection analysis of APOL1 variants. (A) Tajima’s neutrality test involving all 18 nucleotide sequences of APOL1 variants presented in Table 2. Codon positions included were 1st+2nd+3rd. All ambiguous positions were removed for each sequence pair (pairwise deletion option). There were a total of 1194 positions in the final data set. Evolutionary analyses were conducted in MEGA11 [81]. Abbreviations m = number of sequences, n = total number of sites, S = Number of segregating sites, Ps = S/n, θ = ps/a1, π = nucleotide diversity, and D is the Tajima test statistic. (B) SLAC analysis using a maximum likelihood ancestral state reconstruction and minimum path substitution counting. The test applied a simple binomial-based test of whether dS differs from dN. The estimates aggregate information over all branches, so the signal is derived from pervasive diversification or conservation. Amino acid positions of SNPs showing strong positive selection signal (i.e., high dN-dS) are denoted above each column. (C) BUSTED analysis using a random effects branch-site model fitted jointly to all or a subset of tree branches for alignment-wide evidence of episodic diversifying selection. Since an omega > 1 was observed, individual sites were subjected to evidence-ratio style analysis to explore which ones may have been subject to selection. ER ratio values are presented on the y-axis, and sites (amino acid position on the x-axis) above the threshold (blue line) are highlighted by red circles. (D) Codon-based test of positive selection for analysis between sequences. The probability of rejecting the null hypothesis of strict neutrality (dN = dS) in favor of the alternative hypothesis (dN > dS) (below diagonal) is shown. Values of p less than 0.05 are considered significant at the 5% level and are highlighted in yellow. The test statistic (dN-dS) is shown above the diagonal. dS and dN are the numbers of synonymous and nonsynonymous substitutions per site, respectively. The variance of the difference was computed using the analytical method. Analyses were conducted using the Nei–Gojobori method. This analysis involved all 18 nucleotide sequences of APOL1 variants presented in Table 2. All ambiguous positions were removed for each sequence pair (pairwise deletion option). There were a total of 398 positions in the final dataset. Evolutionary analyses were conducted in MEGA11 [81].
Figure 6
Figure 6
Differential APOL1-APOL3 native interaction revealed to be APOL1 haplotype- and cell type-dependent. Western blot analysis of cellular extracts of immortalized podocytes, HepG2, RCC and isogenic RCC cells expressing either G1, G2, or a null-variant of APOL1, after 24 h IFN-γ stimulation and subjected to immunoprecipitation by an anti-APOL3 antibody. (A) A fraction of the lysate was used to assess APOL1 expression levels in the input. Considering the expression of the normalizing protein α-Tubulin across samples, APOL1 was relatively expressed in the same manner across them. (B) The amount of APOL3 protein was evaluated in the eluates of all samples and in the beads-only control sample, to ensure equally effective IP procedure across samples. (C) The amount of APOL1 protein that was Co-IPed with APOL3 was assessed in the same eluates as in (B). A small thin band appears in the beads-only control sample indicating a slight ‘passive’ stickiness of APOL1 to the beads, albeit not in a way that would prevent solid biological interpretation of the results. Abbreviations: IP = immunoprecipitation, IB = immunoblotting, RCCθ = isogenic RCC cells with APOL1 null-variant, MW = molecular weight.
Figure 7
Figure 7
APOL1 G0, G1, and G2 protein folding predictions, alignment and inter-domain interactions. The structure of G0, G1, and G2 was predicted de novo using AlphaFold2. (A) Structure prediction of APOL1 G0 analyzed by PyMOL for all possible amino acid interactions within its chains. Depicted in red and blue are the proposed HC1–LZ1 and HC2–LZ2 domains, respectively. As it is evident from the illustration, they are predicted to be apart from each other, far beyond 4Å, the maximal distance that would allow amino acids to interact through their side chains. (B) Alignment of G0–G1 and (C) G0–G2 ensued afterward also using PyMOL. Amino acids in black are fully aligned in their predicted three-dimensional positioning, while shaded amino acids in gray are non-overlapping and spatially divergent between G0 and its two high-risk counterparts. In bold and underlined are the SNPs of G1 and G2, p.342 + p.384, and p.388–389, respectively. The upper red and blue lines demarcate the HC1–LZ1 and HC2–LZ2 domains, respectively, with the ‘*’ marking the first and last amino acid in the domain.
Figure 8
Figure 8
The interaction interface between APOL1 variants and APOL3 divulged by protein-protein docking computational analysis. AlphaFold2 predictions of APOL1 variants and APOL3 structures were uploaded to the HDOCK server for the evaluation of their interaction interface. (A) The top ten models of each interacting pair are presented in three separate tables, denoting the docking and confidence score of each model. (B) Evaluation of the top model of each pair revealed instantly visible significant changes of the interaction interface between both proteins, deviating markedly with G2, and almost entirely with G1. For precise list of interface residues see Supplementary File S2.

Similar articles

  • A Cell Biologist's View on APOL1: What We Know and What We Still Need to Address.
    Höffken V, Braun DA, Pavenstädt H, Weide T. Höffken V, et al. Cells. 2025 Jun 24;14(13):960. doi: 10.3390/cells14130960. Cells. 2025. PMID: 40643483 Free PMC article. Review.
  • Management of urinary stones by experts in stone disease (ESD 2025).
    Papatsoris A, Geavlete B, Radavoi GD, Alameedee M, Almusafer M, Ather MH, Budia A, Cumpanas AA, Kiremi MC, Dellis A, Elhowairis M, Galán-Llopis JA, Geavlete P, Guimerà Garcia J, Isern B, Jinga V, Lopez JM, Mainez JA, Mitsogiannis I, Mora Christian J, Moussa M, Multescu R, Oguz Acar Y, Petkova K, Piñero A, Popov E, Ramos Cebrian M, Rascu S, Siener R, Sountoulides P, Stamatelou K, Syed J, Trinchieri A. Papatsoris A, et al. Arch Ital Urol Androl. 2025 Jun 30;97(2):14085. doi: 10.4081/aiua.2025.14085. Epub 2025 Jun 30. Arch Ital Urol Androl. 2025. PMID: 40583613 Review.
  • Genetic Inhibition of APOL1 Pore-Forming Function Prevents APOL1-Mediated Kidney Disease.
    Hung AM, Assimon VA, Chen HC, Yu Z, Vlasschaert C, Triozzi JL, Chan H, Wheless L, Wilson O, Shah SC, Mack T, Thompson T, Matheny ME, Chandrasekar S, Mozaffari SV, Chung CP, Tsao P, Susztak K, Siew ED, Estrada K, Gaziano JM, Graham RR, Tao R, Hoek M, Robinson-Cohen C, Green EM, Bick AG; Million Veteran Program. Hung AM, et al. J Am Soc Nephrol. 2023 Nov 1;34(11):1889-1899. doi: 10.1681/ASN.0000000000000219. Epub 2023 Oct 6. J Am Soc Nephrol. 2023. PMID: 37798822 Free PMC article.
  • Behavioral interventions to reduce risk for sexual transmission of HIV among men who have sex with men.
    Johnson WD, Diaz RM, Flanders WD, Goodman M, Hill AN, Holtgrave D, Malow R, McClellan WM. Johnson WD, et al. Cochrane Database Syst Rev. 2008 Jul 16;(3):CD001230. doi: 10.1002/14651858.CD001230.pub2. Cochrane Database Syst Rev. 2008. PMID: 18646068
  • Short-Term Memory Impairment.
    Cascella M, Al Khalili Y. Cascella M, et al. 2024 Jun 8. In: StatPearls [Internet]. Treasure Island (FL): StatPearls Publishing; 2025 Jan–. 2024 Jun 8. In: StatPearls [Internet]. Treasure Island (FL): StatPearls Publishing; 2025 Jan–. PMID: 31424720 Free Books & Documents.

References

    1. Bruce D. The Croonian Lectures on Trypanosomes Causing Disease in Man and Domestic Animals in Central Africa: Delivered Before the Royal College of Physicians of London. BMJ. 1915;2:48–53. doi: 10.1136/bmj.2.2845.48. - DOI - PMC - PubMed
    1. Stephens J.W.W., Fantham H.B. On the peculiar morphology of a trypanosome from a case of sleeping sickness and the possibility of its being a new species (T. rhodesiense) Proc. R. Soc. Lond. Ser. B Contain. Pap. A Biol. Character. 1910;83:28–33. doi: 10.1080/00034983.1910.11685723. - DOI
    1. Hawking F. The differentiation of Trypanosoma rhodesiense from T. brucei by means of human serum. Trans. R. Soc. Trop. Med. Hyg. 1973;67:517–527. doi: 10.1016/0035-9203(73)90082-5. - DOI - PubMed
    1. Rifkin M.R. Identification of the trypanocidal factor in normal human serum: High density lipoprotein. Proc. Natl. Acad. Sci. USA. 1978;75:3450–3454. doi: 10.1073/pnas.75.7.3450. - DOI - PMC - PubMed
    1. Hajduk S.L., Moore D.R., Vasudevacharya J., Siqueira H., Torri A.F., Tytler E.M., Esko J.D. Lysis of Trypanosoma brucei by a Toxic Subspecies of Human High Density Lipoprotein. J. Biol. Chem. 1989;264:5210–5217. doi: 10.1016/S0021-9258(18)83720-6. - DOI - PubMed

LinkOut - more resources