. 2025 Jul 7;14(13):1036.
doi: 10.3390/cells14131036.

Structural and Functional Characterization of N-Glycanase-1 Pathogenic Variants

Affiliations

Structural and Functional Characterization of N-Glycanase-1 Pathogenic Variants

Antje Banning et al. Cells. .

Abstract

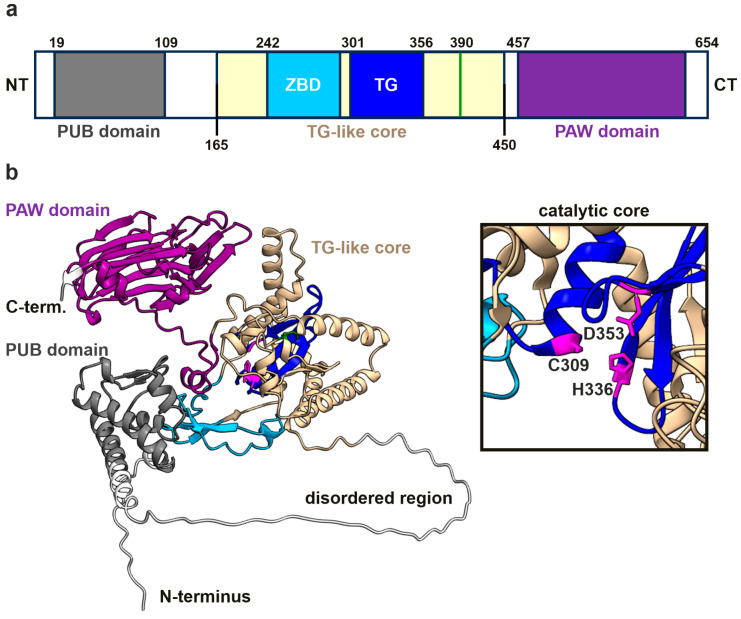
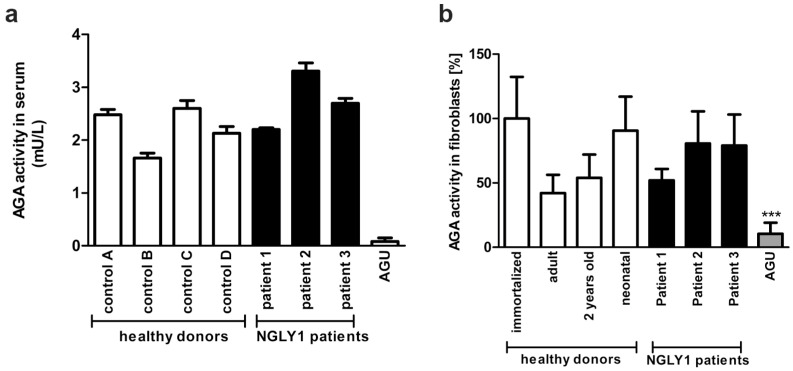
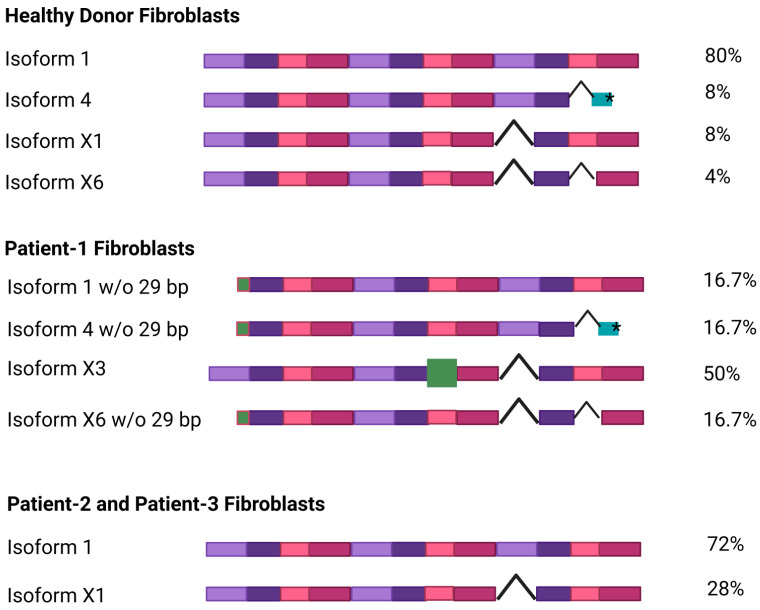
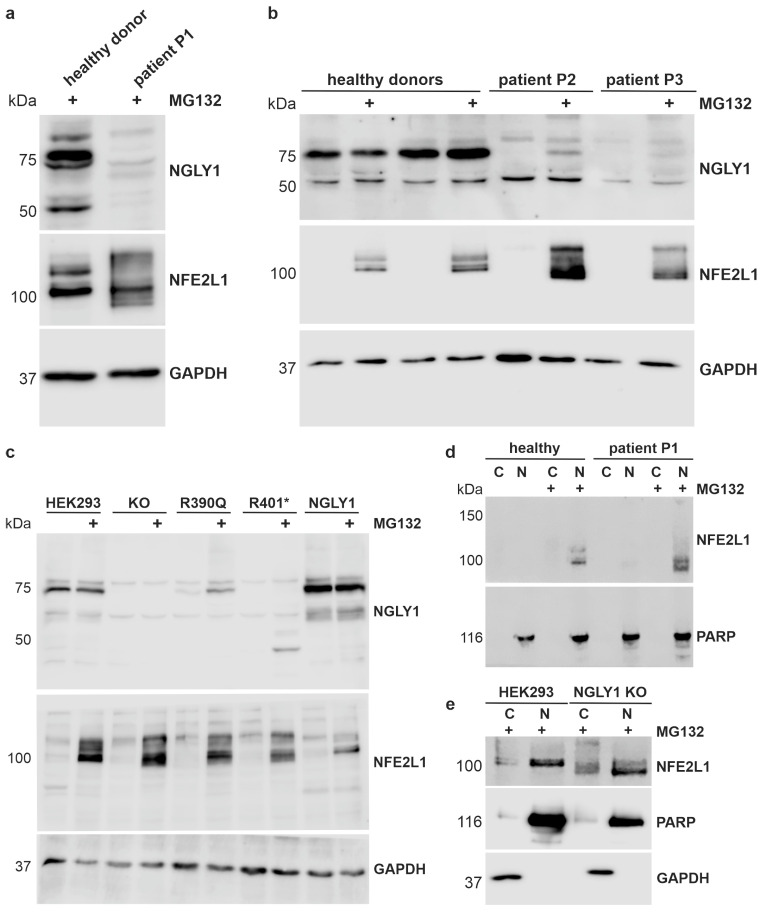
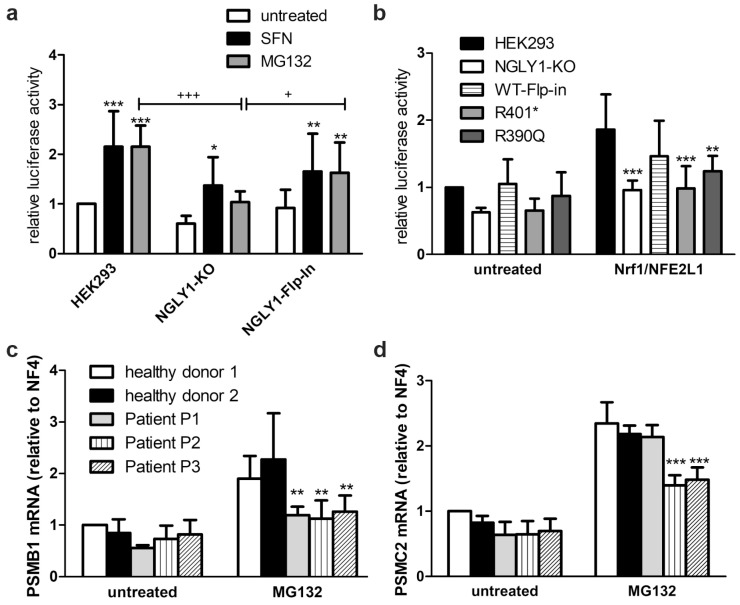
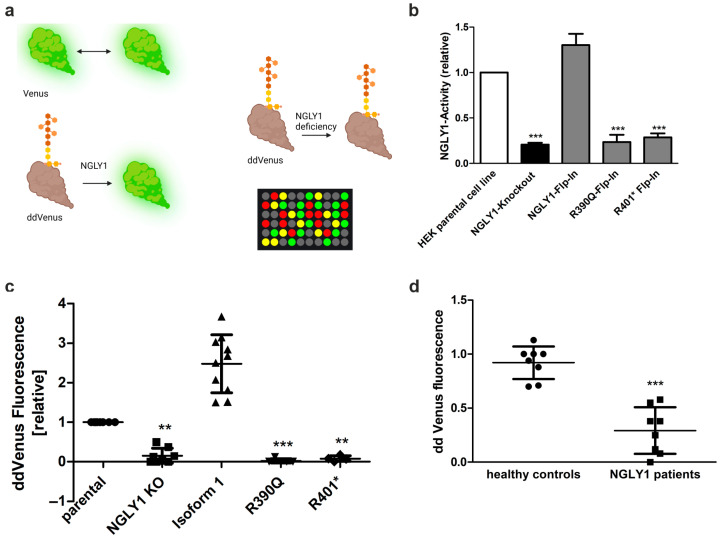
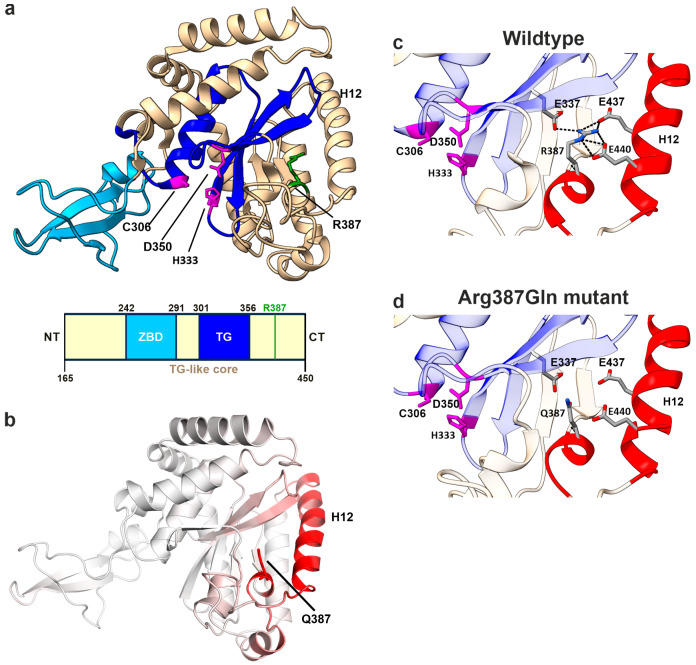
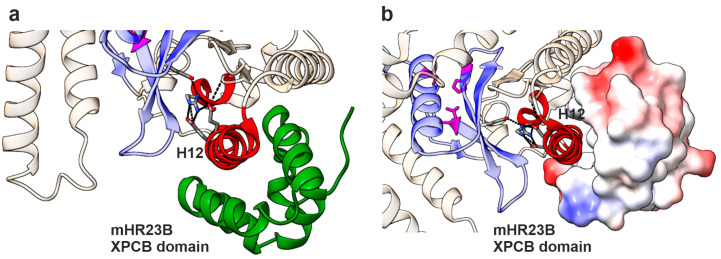
NGLY1 deficiency is a congenital disorder of deglycosylation, caused by pathogenic variants of the NGLY1 gene. It manifests as global developmental delay, hypo- or alacrima, hypotonia, and a primarily hyperkinetic movement disorder. The NGLY1 enzyme is involved in deglycosylation of misfolded N-glycosylated proteins before their proteasomal degradation and in the activation of transcription factors that control the expression of proteasomal subunits. Here, we have characterized the pathogenic NGLY1 variants found in three Swiss NGLY deficiency patients, as well as the most common pathogenic NGLY1 variant, Arg401*, found in about 20% of patients. Our functional and structural assessments of these variants show that they cause a profound reduction in NGLY1 activity, severely reduced expression of NGLY1 protein, and misprocessing of the transcription factor NFE2L1. Furthermore, transcription of proteasomal subunits and NGLY1 mRNA splicing are impaired by some of these variants. Our in silico structural analysis shows that the Arg390Gln substitution results in destabilization of NGLY1 structure due to a loss of an ionic interaction network of Arg390 and potentially impairment of protein-protein interactions. Our results provide important information on the functional and structural effects of pathogenic NGLY1 variants and pave the way for structure-based development of personalized treatment options.

Keywords: ERAD; N-Glycosylation; congenital disorders of deglycosylation; developmental delay; proteasome; protein misfolding.


Conflict of interest statement

The authors declare no conflicts of interest.

Figures

Figure 1
Figure 1
hNGLY1 protein structure predicted by AlphaFold3. (a) Domain structure of hNGLY1 containing the ubiquitin-binding domain (PUB; gray), the carbohydrate-binding domain (PAW; purple), and the transglutaminase-like core (beige) that contains the zinc-binding domain (ZBD; cyan) and the catalytic center (TG; blue). Domains adapted from [4] (TG-like core/ ZBD), [2] (TG domain), and [5] (PUB and PAW); green line indicates the position of R390. (b) The structure of hNGLY1 predicted by AlphaFold3, with the same color coding as in (a). The catalytic core of the TG domain as part of the TG-like core is shown in the magnified window, revealing the catalytic residues Cys309, His336, and Asp353 (in purple).
Figure 2
Figure 2
AGA enzyme activity in NGLY1 patients. (a) AGA activity was measured using equal amounts of serum of healthy controls and NGLY1 patients (n = 3). The mean of AGU patients (n = 20) was used as a control. (b) Fibroblasts from three NGLY1 patients, four healthy donors, and four AGU patients were grown on 10 cm dishes. AGA activity was measured in the cell lysates and normalized to total protein amount. Serum samples were measured in triplicate, and AGA activity in fibroblasts was measured 3 times for patients P2 and P3 and 6 times for patient P1 and the healthy donors. *** p < 0.001 AGU vs. all other samples.
Figure 3
Figure 3
NGLY1 isoforms in healthy donors and NGLY1 patients. Total RNA was isolated and reversely transcribed from dermal fibroblasts, and the coding sequence of NGLY1 was amplified by PCR. The resulting PCR products were cloned into the pcDNA3 vector and sequenced. Each exon is shown as a colored box; exon skipping is indicated with a hooked line. The green boxes show a truncated exon (isoform 4, *premature stop codon) or an alternative exon (isoform X3). The percentage of each isoform among the sequenced clones is indicated on the right. Figure created with BioRender. Tikkanen, R. (2025) https://BioRender.com/41zizp5.
Figure 4
Figure 4
Misprocessing of the transcription factor NFE2L1 in patient cells and in NGLY1-deficient HEK293 cells. (a,b) Dermal fibroblasts from healthy donors and NGLY1 patients P1, P2, and P3 were treated overnight with 1 µM MG132. Cell lysates were analyzed by SDS-PAGE and Western blot. GAPDH was used as a loading control. NFE2L1 was only detectable upon proteasome inhibition and showed a misprocessing in NGLY1-deficient cells. (c) Stable expression (knock-in) of the WT NGLY1 and the NGLY1 variants R390Q and R401* in NGLY1-deficient HEK293 cells. Parental HEK293 and NGLY1-KO cells were used as controls. After treatment with MG132, NGLY1 and NFE2L1 expression were analyzed by Western blot. The experiments in (ac) were performed at least 4 times. (d,e) Nuclear extracts were prepared from fibroblasts of patient P1 and a healthy donor (d), as well as parental HEK293 and NGLY1 KO cells (e) (three independent experiments each), to study if NFE2L1 is able to reach the nucleus in the absence of NGLY1. Amounts of NGLY1 and NFE2L1 in the nuclear (N) and cytosolic fractions (C) were compared by Western blot. PARP1 was used as a nuclear marker, and GAPDH served as a marker for the cytosolic fraction.
Figure 5
Figure 5
Reduced activity of NFE2L1 and reduced expression of NFE2L1 target genes in NGLY1-deficient cells. (a) HEK293, NGLY1-KO, and NGLY1 knock-in cells were transfected with a reporter gene construct containing the antioxidant response element upstream of firefly luciferase. Twenty-four hours after transfection, the cells were exposed to MG132 (1 µM) or sulforaphane (SFN, 10 µM) for 18 h. Firefly luciferase activity was normalized to renilla luciferase. Bars show mean ± SD of 6 independent experiments. Two-way ANOVA against untreated cells. (b) HEK293 cells (parental, NGLY1-KO, NGLY1 knock-in, and cells expressing the variants R401* and R390Q) were transfected either with the reporter gene construct in combination with an NFE2L1 expression construct, or the empty vector. Reporter gene activity was measured 48 h after transfection. Bar graphs show means ± SD of 5 independent experiments. Two-way ANOVA against parental cell line. (c,d) Patient fibroblasts were grown to confluence. RNA was extracted, reverse-transcribed, and amplified by real-time PCR. For normalization, the mean of the reference genes B2M, Rpl13a, Ywhaz, and GAPDH was used. Shown are the mean values ± SD of 3 independent experiments. Two-way ANOVA against healthy donors 1 and 2. * p < 0.05, ** p < 0.01, *** p < 0.001 against untreated HEK293; + p < 0.05, +++ p < 0.001 as indicated.
Figure 6
Figure 6
NGLY1 in vivo and in vitro activity assays. (a) Assay principle. NGLY1-mediated deglycosylation of the non-fluorescent ddVenus results in the appearance of the fluorescent Venus signal. Fluorescence of unmodified Venus serves as a positive control. (b) HEK293 cells were transfected with constructs for either Venus or ddVenus. For normalization, a plasmid encoding mCherry was cotransfected in equal amounts. NGLY1 activity of MG132-treated cells expressing the patient variants Arg390Gln or Arg401* was compared to that of NGLY1 KO cells. Bars show means ± SD of 3 independent experiments. One-way ANOVA against HEK293 parental cell line (*** p < 0.001). (c,d) NGLY1 in vitro activity assay. Cell homogenates of (c) HEK293 cells (n ≥ 4) or (d) fibroblasts (n = 8) were incubated with equal amounts of homogenate of cells expressing ddVenus (MG132-treated), and the fluorescence was followed over time. Data show relative mean fluorescence values ± SD of equal amounts of total protein after 48 h of incubation. (c) One-way ANOVA against parental cell line; (d) unpaired t-test against healthy controls. (c,d) ** p < 0.01, *** p < 0.001; (a) Created by BioRender. Tikkanen, R. (2025) https://BioRender.com/z0q3nku.
Figure 7
Figure 7
Structural analysis of R387Q variant in mNGLY1. (a) Protein structure of mNGLY1 transglutaminase-like-core domain (beige) harboring the catalytic TG domain (blue) and the zinc-binding domain (cyan). The catalytic triad residues Cys306, Asp350, and His333 are indicated in purple and Arg387 in green (PDB: 2F4M). Schematic presentation of the domain structure of mNGLY1 transglutaminase-like-core domain; domains adapted from [4] (TG-like core/ ZBD) and [2] (TG domain); the green bar indicates the position of Arg387Gln (=Arg390Gln in hNGLY1). (b) Dynamut analysis of Arg387Gln (n = 3) in mNGLY1 structure reveals changes in the vibrational entropy in the neighboring helix 12 (H12, red), contributing to increased flexibility. The degree of changes in the vibrational entropy correlates with the red color intensity. (c) Structural analysis of WT mNGLY1 shows ionic interactions (black dashed lines) between Arg387 and Glu337, and Glu437 and Glu440, stabilizing the protein structure and the adjacent catalytic core. (d) The ionic network is lost due to the Arg387Gln exchange. Red color indicates the structural regions with increased flexibility, as predicted by Dynamut.
Figure 8
Figure 8
Binding interface of the HR23B-XPCB domain with mNGLY1. (a) Protein structure of mNGLY1 transglutaminase-like-core domain in complex with the HR23B-XPCB domain (green); (PDB: 2F4M; [4]). Changes in flexibility due to Arg387Gln mutation predicted by Dynamut are colored in red, including helix 12. The structure reveals H12 as the main interaction site between mNGLY1 and the HR23B-XPCB domain. Color codes as in Figure 7. (b) H12 binds in the hydrophobic pocket of the XPCB domain, as shown by electrostatic coloring of the surface mode of HR23B (blue = positive charge; red = negative charge; white = neutral).

Similar articles

References

    1. Huang C., Harada Y., Hosomi A., Masahara-Negishi Y., Seino J., Fujihira H., Funakoshi Y., Suzuki T., Dohmae N., Suzuki T. Endo-β-N-acetylglucosaminidase forms N-GlcNAc protein aggregates during ER-associated degradation in Ngly1-defective cells. Proc. Natl. Acad. Sci. USA. 2015;112:1398–1403. doi: 10.1073/pnas.1414593112. - DOI - PMC - PubMed
    1. Suzuki T., Huang C., Fujihira H. The cytoplasmic peptide:N-glycanase (NGLY1)-Structure, expression and cellular functions. Gene. 2016;577:1–7. doi: 10.1016/j.gene.2015.11.021. - DOI - PMC - PubMed
    1. Pandey A., Adams J.M., Han S.Y., Jafar-Nejad H. NGLY1 Deficiency, a Congenital Disorder of Deglycosylation: From Disease Gene Function to Pathophysiology. Cells. 2022;11:1155. doi: 10.3390/cells11071155. - DOI - PMC - PubMed
    1. Zhao G., Zhou X., Wang L., Li G., Kisker C., Lennarz W.J., Schindelin H. Structure of the mouse peptide N-glycanase-HR23 complex suggests co-evolution of the endoplasmic reticulum-associated degradation and DNA repair pathways. J. Biol. Chem. 2006;281:13751–13761. doi: 10.1074/jbc.M600137200. - DOI - PubMed
    1. Miao X., Wu J., Chen H., Lu G. Comprehensive Analysis of the Structure and Function of Peptide:N-Glycanase 1 and Relationship with Congenital Disorder of Deglycosylation. Nutrients. 2022;14:1690. doi: 10.3390/nu14091690. - DOI - PMC - PubMed

MeSH terms

Substances

Supplementary concepts

LinkOut - more resources