. 2025 Oct 6;222(10):e20242296.
doi: 10.1084/jem.20242296. Epub 2025 Jul 11.

The STING pathway drives noninflammatory neurodegeneration in NGLY1 deficiency

Affiliations

The STING pathway drives noninflammatory neurodegeneration in NGLY1 deficiency

Kun Yang et al. J Exp Med. .

Abstract

The STING pathway is increasingly recognized as a key regulator of neuroinflammation in neurodegenerative disease, but its role in noninflammatory conditions remains unclear. We generated a postnatal inducible whole-body Ngly1 knockout mouse (iNgly1-/-) to model NGLY1 deficiency, an early-onset neurodegenerative disorder. iNgly1-/- mice exhibit progressive motor deficits, Purkinje cell loss, and shortened lifespan without evidence of gliosis or immune activation. Cell type-specific deletion of Ngly1 in Purkinje cells or microglia failed to induce disease, suggesting multiple cell-intrinsic and cell-extrinsic signals are required. Genetic ablation of Sting1 in iNgly1-/- mice rescues Purkinje cell loss, improves motor function, and extends lifespan. Single-nucleus RNA sequencing reveals proteostasis disruption in Purkinje cells, altered cerebellar granule cell subpopulations, and STING-dependent suppression of cholesterol biosynthesis in glia. Pharmacological inhibition of STING with an orally bioactive antagonist, VS-X4, significantly mitigates neuropathology and motor disease. These findings identify STING as a key mediator of neuropathology in NGLY1 deficiency and implicate a role of STING in noninflammatory neurological disease.


Conflict of interest statement

Disclosures: W.F. Mueller reported personal fees from Grace Science, LLC, outside the submitted work; in addition, W.F. Mueller had a patent to US20240218396A1 issued. K. Lee is an employee of the Grace Science Foundation, a nonprofit foundation that provided partial support for this study. No other disclosures were reported.

Figures

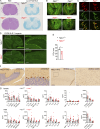
Figure 1.
Figure 1.
Characterization of postnatal inducible whole-body Ngly1 knockout mice. (A) Schematic diagram showing the generation of postnatal inducible whole-body Ngly1 knockout (iNgly1−/−) mice. (B) Western blot analysis of the NGLY1 protein in brain, liver, and spleen of iNgly1−/− and Ngly1fl/fl control mice. The data were verified in at least two independent experiments. (C) Body weight of iNgly1−/− and Ngly1fl/fl mice (n = 4–25 each time point). Data are shown as the mean ± SEM. Two-way ANOVA. ***P < 0.001. (D) Survival curves of iNgly1−/− (n = 49 males, 40 females) and Ngly1fl/fl (n = 38 males, 45 females) mice. Log-rank (Mantel–Cox) test. **P < 0.01; ***P < 0.001. (E) Representative image of kyphosis of iNgly1−/− mice at 3 mo old. (F) Neurological deficit score of iNgly1−/− and Ngly1fl/fl mice. Data are shown as median ± 95% CI. Mann–Whitney U test. ***P < 0.001. Source data are available for this figure: SourceData F1.
Figure S1.
Figure S1.
Characterization of Ngly1-deficient mice. (A) H&E and Luxol fast blue analysis of the thoracic spinal cord of 6-mo-old iNgly1−/− and iNgly1fl/fl control mice. The data are representative of at least three independent mice per genotype. (B and C) Innervation (B) and synaptic size (C) of E18.5 Ngly1−/− and littermate fetus (n = 2 per genotype). α-Bungarotoxin was used to label postsynaptic ACh receptors in the muscle (red), and antibody against syntaxin was used to label presynaptic nerves (green). Low-power (10×) views of the phrenic nerve/diaphragms (B); scale bar, 2 mm. Note: the images were rotated after acquisition for presentation to maintain consistent anatomical orientation across samples. Nontissue triangular regions in the corners were outlined with dashed white lines. High-power (63×) views of neuromuscular junctions in the diaphragm (C); scale bar, 20 μm. Presynaptic nerve terminal, green; postsynaptic AChRs, red. (D) Representative fluorescent IHC staining of Purkinje cell marker calbindin (green) in cerebella of 5-wk-old JF1/BL6 isogenic F1 Ngly1−/− and Ngly1+/+ control mice. n = 3 per genotype. Scale bar, 500 μm (left), 100 μm (right). (E) Quantification of calbindin-immunoreactive Purkinje cells shown in D. Data are shown as the mean ± SEM. Student’s t test. *P < 0.05. (F) Representative IHC staining of NGLY1 in cerebellum (left) and cerebral cortex (right) of cynomolgus macaque monkeys. Scale bar, 500 μm (zoom-out), 100 μm (zoom-in). (G) Multiplex cytokine analysis of female and male iNgly1−/− (n = 10 females, 9 males) and Ngly1fl/fl (n = 8 females, 8 males) mouse serum.
Figure 2.
Figure 2.
Purkinje cell loss in iNgly1 −/− mice and an NGLY1 patient. (A and B) IHC staining of calbindin in cerebella of 6-mo-old iNgly1−/− and Ngly1fl/fl mice. Scale bar, 500 μm (upper), 100 μm (lower). Quantification of calbindin-immunoreactive Purkinje cells is shown in B. Data are shown as the mean ± SEM. Unpaired Student’s t test. ***P < 0.001. (C and D) Representative images of H&E staining (C) and calbindin IHC-DAB staining (D) of cerebella of a NGLY1 deficiency patient and an age-matched healthy individual. Scale bar, 500 μm (left), 100 μm (right). Note: cerebellar atrophy in NGLY1 deficiency patient (low magnification in D). (E and F) Fluorescent IHC staining of cleaved caspase-3 (cl-Casp3, green) and calbindin (red) in cerebella of 6-wk-old iNgly1−/− and Ngly1fl/fl mice. Scale bar, 50 μm. Quantification of cl-Casp3+ Purkinje cells per midsagittal section is shown in F. Data are the mean ± SEM of iNgly1−/− (n = 12) and Ngly1fl/fl (n = 12) mice. Unpaired Student’s t test. ***P < 0.001. (G and H) Fluorescent IHC staining of mitochondrial marker COX IV (green) and calbindin (red) in cerebella of 6-wk-old iNgly1−/− and iNgly1fl/fl control mice. Scale bar, 25 μm. Quantification of COX IV fluorescence intensity in Purkinje cell soma is shown in H. Data are the mean ± SEM of at least 18 Purkinje cells of iNgly1−/− (n = 6) and Ngly1fl/fl (n = 4) mice. Unpaired Student’s t test. ***P < 0.001.
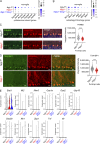
Figure 3.
Figure 3.
Lack of neuroinflammation in iNgly1 −/− mice. (A–C) Heatmap of mRNA expression in cerebella of iNgly1−/− (n = 7) and iNgly1fl/fl control (n = 9) mice. mRNA was measured by RT-qPCR array. Bar graphs are shown as the mean ± SEM. Unpaired Student’s t test. **P < 0.01; ***P < 0.001; ns, not significant. (D) Representative fluorescent IHC staining of microglial marker IBA1 (red) in cerebella of 3-mo-old iNgly1−/− and iNgly1fl/fl control mice. The nucleus was stained with DAPI (blue). Scale bar, 2 mm (left), 500 μm (right). Images were acquired using Zeiss AxioScan with automated stitching. (E) Quantification of microglia numbers (IBA1, red in D) in the FOV of the cerebellar molecular layer of iNgly1−/− (n = 13) and Ngly1fl/fl (n = 11) mice. Data are the mean ± SEM. Unpaired Student’s t test, ns, not significant. (F) Representative fluorescent IHC staining of microglial marker IBA1 (green) in cerebella of 5-wk-old C57BL/6-JF1 isogenic F1 Ngly1−/− and Ngly1+/+ control mice. Scale bar, 500 μm. Images were acquired using Hamamatsu NanoZoomer with automated stitching. (G) Quantification of microglial numbers (IBA1, green in F) in the FOV of the cerebellar molecular layer of C57BL/6-JF1 isogenic F1 Ngly1−/− (n = 3) and Ngly1+/+ (n = 3) mice. Data are the mean ± SEM. Unpaired Student’s t test, ns, not significant. (H) Representative IHC staining of microglial marker IBA1, activation marker CD68, and astrocyte marker GFAP in cerebella of 6-mo-old iNgly1−/− and iNgly1fl/fl control mice. The data were verified in at least three mice. Scale bar, 50 μm (IBA1 upper, CD68 upper, and GFAP), 10 μm (IBA1 lower, CD68 lower). FOV, field of view.
Figure S2.
Figure S2.
Deletion of Ngly1 in Purkinje cells or microglia alone did not cause neurodegeneration. (A) Representative IHC staining of Purkinje cell marker calbindin in cerebella of 6-mo-old Ngly1fl/fl, Ngly1fl/flPcp2-cre, and Ngly1fl/flCx3cr1-cre control mice. Scale bar, 1 mm (upper panel), 100 μm (lower panel). (B) Quantification of calbindin-immunoreactive Purkinje cells shown in A. Data are shown as the mean ± SEM. Unpaired Student’s t test. ns, not significant.
Figure 4.
Figure 4.
Sting1 −/− ameliorates neurological disease of iNgly1 −/− mice. (A) Schematic diagram showing generation of iNgly1−/−Sting1−/− mice. (B) Survival curves of Ngly1fl/fl, Ngly1fl/flSting1−/−, iNgly1−/−, and iNgly1−/−Sting1−/− male mice. Log-rank (Mantel–Cox) test. **P < 0.01; ***P < 0.001. (C) Neurological deficit score of Ngly1fl/fl, Ngly1fl/flSting1−/−, iNgly1−/−, and iNgly1−/−Sting1−/− male mice. Data were shown as median ± 95% CI. Mann–Whitney test. (D) IHC staining of calbindin in cerebella of 1-year-old Ngly1fl/fl, Ngly1fl/flSting1−/−, iNgly1−/−, and iNgly1−/−Sting1−/− mice. Scale bar, 500 μm (upper), 100 μm (lower). (E) Quantification of Purkinje cell number of indicated genotypes. Data were shown as the mean ± SEM. One-way ANOVA with Bonferroni’s multiple comparisons test. **P < 0.01; ***P < 0.001. (F and G) IHC staining of cleaved caspase-3 (cl-Casp3, green) and calbindin (red) in cerebella of 8-wk-old Ngly1fl/fl, Ngly1fl/flSting1−/−, iNgly1−/−, and iNgly1−/−Sting1−/− mice. Scale bar, 50 μm. Quantification of cl-Casp3+ Purkinje cells per midsagittal cerebellar section is shown in G. Data are from mice (n = 12 per genotype) of three independent experiments. Data were shown as the mean ± SEM. One-way ANOVA with Bonferroni’s multiple comparisons test. ***P < 0.001.
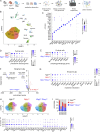
Figure 5.
Figure 5.
snRNA-seq analysis of cells in iNgly1 −/− mouse cerebellum. (A) Experimental workflow of snRNA-seq of 8-wk-old Ngly1fl/fl, iNgly1−/−, and iNgly1−/−Sting1−/− mouse cerebella (n = 2 mice per genotype). (B) UMAP plot of all cells from iNgly1−/−, iNgly1−/−Sting1−/−, and Ngly1fl/fl mouse cerebella. (C) Dot plots of cell type–specific marker genes. (D and E) Dot plots of proteasome subunit and autophagy/mitophagy-related genes in Ngly1fl/fl, iNgly1−/−, and iNgly1−/−Sting1−/− Purkinje cells. (F) Pathway enrichment analysis of DEGs between Ngly1fl/fl and iNgly1−/− Bergmann glia. (G) Dot plots of cholesterol metabolism–related genes in Ngly1fl/fl, iNgly1−/−, and iNgly1−/−Sting1−/− Bergmann glia. (H) UMAP plot of granule cell subcluster from Ngly1fl/fl, iNgly1−/−, or iNgly1−/−Sting1−/− mouse cerebella. (I) Quantification of three genotypes in each granule cell subcluster. (J) Dot plots of hallmark gene expression in GC1 and GC2 subclusters. UMAP, Uniform Manifold Approximation and Projection.
Figure S3.
Figure S3.
snRNA-seq analysis of cells in iNgly1 −/− mouse cerebellum. (A and B) Dot plots of proteasome subunit and autophagy/mitophagy-related gene expression in Ngly1fl/fl, iNgly1−/−, and iNgly1−/−Sting1−/− mouse microglia. (C and D) Fluorescent IHC staining of PSMB2 and TAX1BP1 in 8-wk-old Ngly1fl/fl, iNgly1−/− cerebella. Scale bar, 20 μm. Fluorescence intensity per Purkinje cell of >200 cells from four mice per genotype was quantified and is shown on the right. Unpaired Student’s t test. ***P < 0.001. (E) Violin plots of ISG gene expression in Ngly1fl/fl, iNgly1−/−, and iNgly1−/−Sting1−/− mouse microglia.
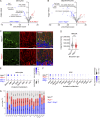
Figure S4.
Figure S4.
Dysregulation of cholesterol biosynthesis in iNgly1 −/− mouse cerebellum. (A and B) Pathway enrichment analysis of DEGs between Ngly1fl/fl and iNgly1−/− astrocytes and oligodendrocytes. (C and D) Fluorescent IHC staining of HMGCR in 8-wk-old Ngly1fl/fl and iNgly1−/− cerebella. Scale bar, 20 μm. Fluorescence intensity per Bergmann glia of >130 cells from four mice per genotype was quantified and shown in D. Unpaired Student’s t test. ***P < 0.001. (E and F) Dot plots of cholesterol metabolism–related genes in Ngly1fl/fl, iNgly1−/−, and iNgly1−/−Sting1−/− astrocytes and oligodendrocytes (ODC). (G) Quantification of Ngly1fl/fl, iNgly1−/−, and iNgly1−/−Sting1−/− (three genotypes in each cluster).
Figure S5.
Figure S5.
Cytosolic release of mtDNA in iNgly1 −/− mouse cerebellum. (A) Immunoprecipitation of endogenous cGAS in the Ngly1fl/fl, iNgly1−/− cerebellar lysate. n = 3 mice per genotype. (B) qPCR analysis of cGAS-bound mtDNA in the Ngly1fl/fl, iNgly1−/− cerebellar lysate. n = 3 mice per genotype. Data are the mean ± SEM. Unpaired Student’s t test. **P < 0.01. (C) Quantification of cholesterol in Ngly1fl/fl, iNgly1−/− cerebella. n = 3 mice per genotype. Data are the mean ± SEM. Unpaired Student’s t test. *P < 0.05. (D) Quantification of cholesterol in SK-N-SH cells treated with simvastatin at indicated concentrations for 24 h. Data are the mean ± SEM of three biological replicates. Unpaired Student’s t test. ***P < 0.001. (E) qRT-PCR analysis of IFNB1 gene expression in simvastatin-treated SK-N-SH cells after with or without diABZI (2 µM) treatment for 2 h. Data are the mean ± SEM of three biological replicates. Unpaired Student’s t test. *P < 0.05; ns, not significant. (F) Quantification of cholesterol in SK-N-SH cells treated with cholesterol-depleting agent MβCD at indicated concentrations for 48 h. Data are the mean ± SEM of three biological replicates. Unpaired Student’s t test. ***P < 0.001. (G) qRT-PCR analysis of IFNB1 gene expression in MβCD-treated SK-N-SH cells after with or without diABZI (2 µM) treatment for 2 h. Data are the mean ± SEM of three biological replicates. Unpaired Student’s t test. *P < 0.05; ns, not significant. Source data are available for this figure: SourceData FS5.
Figure 6.
Figure 6.
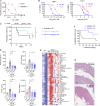
Orally bioactive STING antagonist VS-X4 ameliorates STING-mediated autoimmune disease. (A) IC50 of VS-X4 in THP-1 and RAW264.7 cells treated with 10 μM 2′-5′-cGAMP. (B) IC50 of VS-X4 and H-151 in MEFs or THP-1 treated with 10 μM 2′-5′-cGAMP. (C) Survival of Trex1−/− mice treated with vehicle or VS-X4 intraperitoneally at the indicated doses. Log-rank (Mantel–Cox) test. *P < 0.05; ns, not significant. (D) Serum cytokines in Trex1−/− mice treated with vehicle or VS-X4 were measured at 8 wk after treatment. Data are shown as the mean ± SEM. (E) Unpaired Student’s t test. *P < 0.05; **P < 0.01. (E) Serum autoantibodies in Trex1−/− mice treated with vehicle or VS-X4 were analyzed using an autoantibody microarray. (F) Survival of Trex1−/− mice treated with vehicle or VS-X4 orally. Log-rank (Mantel–Cox) test. *P < 0.05. (G) H&E staining of Trex1−/− mouse hearts treated with vehicle or VS-X4.
Figure 7.
Figure 7.
Pharmacological inhibition of STING ameliorates neurological disease of NGLY1 deficiency. (A) Experimental workflow of treatment of iNgly1−/− mice. (B) Neurological deficit score of Ngly1fl/fl (n = 7 mice) and iNgly1−/− mice treated with STING inhibitor VS-X4 (n = 8 mice) or vehicle control (n = 9 mice). Data were shown as median ± 95% CI. Mann–Whitney U test. **P < 0.01; ***P < 0.001; ns, not significant. (C) Disease onset (disease incidence in the month when kyphosis score reaches 2) of Ngly1fl/fl (n = 7 mice) and iNgly1−/− mice treated with STING inhibitor VS-X4 (n = 8 mice) or vehicle control (n = 9 mice). Log-rank (Mantel–Cox) test. *P < 0.05. (D) IHC staining of calbindin in cerebella of iNgly1−/− mice treated with the STING inhibitor VS-X4 or vehicle control for 3 mo. Scale bar, 500 μm (upper), 100 μm (lower). (E) Quantification of Purkinje cell number of iNgly1−/− mice treated with the STING inhibitor VS-X4 or vehicle control for 3 mo. One-way ANOVA with Bonferroni’s multiple comparisons test. *P < 0.05; **P < 0.01.

Similar articles

References

    1. Ahn, J., Ruiz P., and Barber G.N.. 2014. Intrinsic self-DNA triggers inflammatory disease dependent on STING. J. Immunol. 193:4634–4642. 10.4049/jimmunol.1401337 - DOI - PMC - PubMed
    1. Asahina, M., Fujinawa R., Fujihira H., Masahara-Negishi Y., Andou T., Tozawa R., and Suzuki T.. 2021. JF1/B6F1 Ngly1(−/−) mouse as an isogenic animal model of NGLY1 deficiency. Proc. Jpn. Acad. Ser. B Phys. Biol. Sci. 97:89–102. 10.2183/pjab.97.005 - DOI - PMC - PubMed
    1. Asahina, M., Fujinawa R., Nakamura S., Yokoyama K., Tozawa R., and Suzuki T.. 2020. Ngly1−/− rats develop neurodegenerative phenotypes and pathological abnormalities in their peripheral and central nervous systems. Hum. Mol. Genet. 29:1635–1647. 10.1093/hmg/ddaa059 - DOI - PMC - PubMed
    1. Ayhan, F., Kulkarni A., Berto S., Sivaprakasam K., Douglas C., Lega B.C., and Konopka G.. 2021. Resolving cellular and molecular diversity along the hippocampal anterior-to-posterior axis in humans. Neuron. 109:2091–2105.e6. 10.1016/j.neuron.2021.05.003 - DOI - PMC - PubMed
    1. Barasa, L., Chaudhuri S., Zhou J.Y., Jiang Z., Choudhary S., Green R.M., Wiggin E., Cameron M., Humphries F., Fitzgerald K.A., and Thompson P.R.. 2023. Development of LB244, an irreversible STING antagonist. J. Am. Chem. Soc. 145:20273–20288. 10.1021/jacs.3c03637 - DOI - PMC - PubMed

MeSH terms