

Pulmonary function and comparative SARS-CoV-2 RBD-specific IgG antibody response among the COVID-19 recovered group
- PMID: 40644485
- PMCID: PMC12250562
- DOI: 10.1371/journal.pone.0318959
Pulmonary function and comparative SARS-CoV-2 RBD-specific IgG antibody response among the COVID-19 recovered group
Abstract
Background: Coronavirus disease 2019 (COVID-19) is a highly contagious infectious disease caused by severe acute respiratory syndrome coronavirus 2 (SARS-CoV-2) responsible for millions of deaths and substantial morbidity worldwide. Several studies report that up to 50% of individuals who recover from acute SARS-CoV-2 infection experience a plethora of long-COVID symptoms that may persist for weeks, months, or even up to a year. Abnormal pulmonary function is one of the most critical manifestations of long-COVID, even after recovering from COVID-19. Understanding the long-term pulmonary consequences and immune response among individuals recovering from COVID-19, who experienced disease severity ranging from mild to severe, is crucial for comprehensive post-recovery care and vaccination strategies.
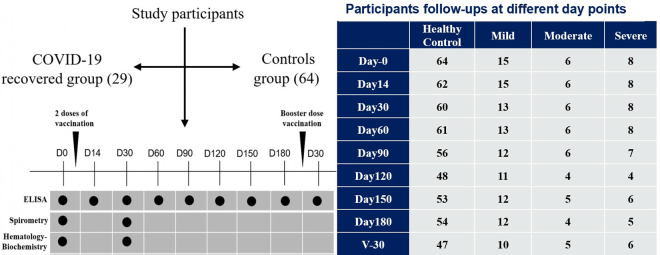
Methods: This prospective case-control study included 29 individuals who had recovered from COVID-19 with a history of mild to severe symptoms and 64 controls. Assessments of pulmonary functional measures, such as FVC, FEV1, FEV1/FVC ratio, FEF, MEF, and PEF were carried out following recovery from COVID-19. Additionally, IgG antibody responses were examined by ELISA for up to six months through multiple follow-ups following two doses of vaccination, with an additional follow-up 30 days after the booster dose (third dose).
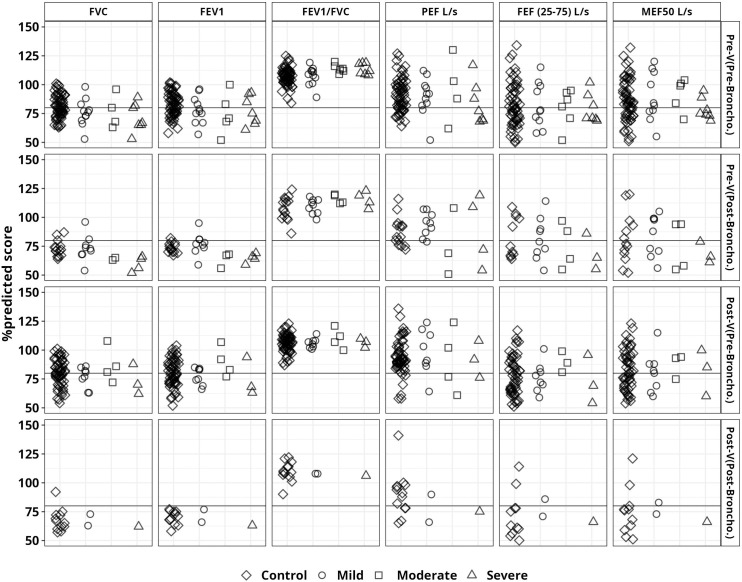
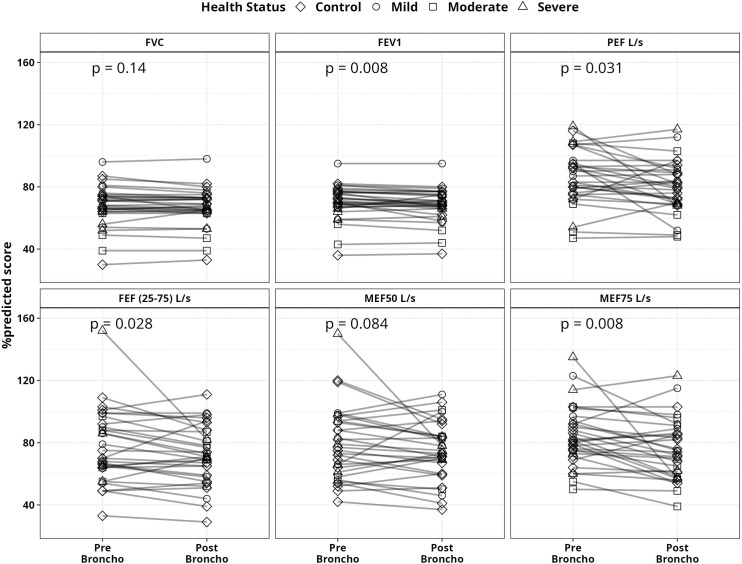
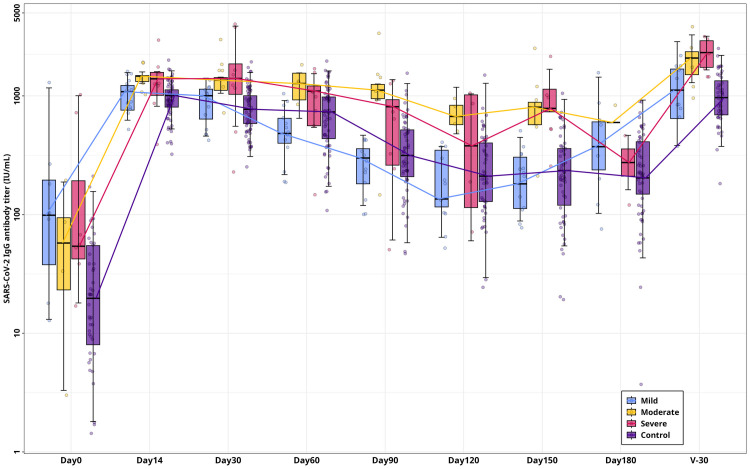
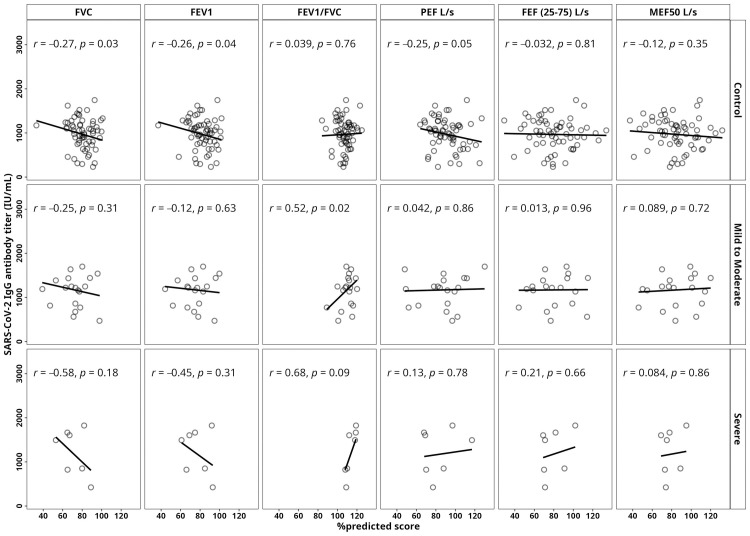
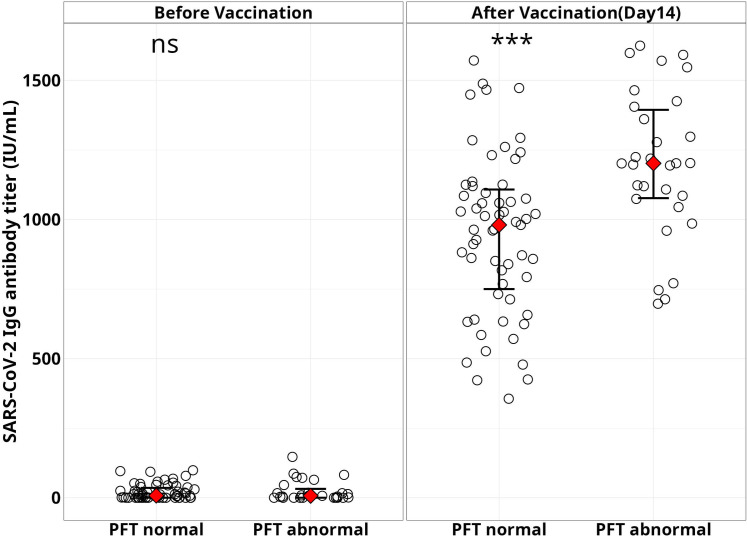
Results: Pulmonary functional abnormalities were prevalent in the recovered group, which had previously exhibited varying symptom severity (53% mild, 66% moderate, and 50% severe) compared to the control group (23%). Higher IgG antibody titers were observed among the recovered group, with significantly elevated titers in severe and moderate cases following vaccination. After vaccination, the recovered group showed significantly higher titers at day 14, particularly in the severe (1418 IU/mL) and moderate (1390 IU/mL) groups, compared to the control group (968 IU/mL) (p < 0.005). Notably, antibody titers were negatively correlated with pulmonary function test (PFT) parameters such as Forced Vital Capacity (FVC) and Forced Expiratory Volume in 1 second (FEV1). All groups experienced a significant (p < 0.005) decrease in antibody titers within 90-120 days after receiving two doses of vaccination. After five to six months, antibody titers returned to baseline levels, highlighting the importance of vaccination and additional booster doses regardless of previous infection history. Overall, our study underscores the significance of pulmonary function assessment post-COVID-19 recovery for long-term respiratory health and emphasizes the importance of vaccination regardless of infection history.
Conclusion: To assess the impact of long-COVID on respiratory health, this study underscores the importance of evaluating pulmonary function in individuals, whether they had symptomatic or asymptomatic COVID-19. Furthermore, the findings from the immune response analysis highlight the critical role of vaccination, regardless of infection history, as a key strategy of pandemic preparedness.
Copyright: © 2025 Siddik et al. This is an open access article distributed under the terms of the Creative Commons Attribution License, which permits unrestricted use, distribution, and reproduction in any medium, provided the original author and source are credited.
Conflict of interest statement
No authors have competing interests.
Figures
References
-
- Tackling the COVID-19 pandemic: The Bangladesh perspective. PMC. Available from: https://www.ncbi.nlm.nih.gov/pmc/articles/PMC7582102/. - PMC - PubMed
-
- Yao XH, Li TY, He ZC, Ping YF, Liu HW, Yu SC. A pathological report of three COVID-19 cases by minimal invasive autopsies. Zhonghua Bing Li Xue Za Zhi. 2020;49(5):411–7. - PubMed
MeSH terms
Substances
LinkOut - more resources
Full Text Sources
Medical
Miscellaneous
