. 2025 Jul 11;21(7):e1012882.
doi: 10.1371/journal.pcbi.1012882. eCollection 2025 Jul.

Time-series modeling of epidemics in complex populations: Detecting changes in incidence volatility over time

Affiliations

Time-series modeling of epidemics in complex populations: Detecting changes in incidence volatility over time

Rachael Aber et al. PLoS Comput Biol. .

Abstract

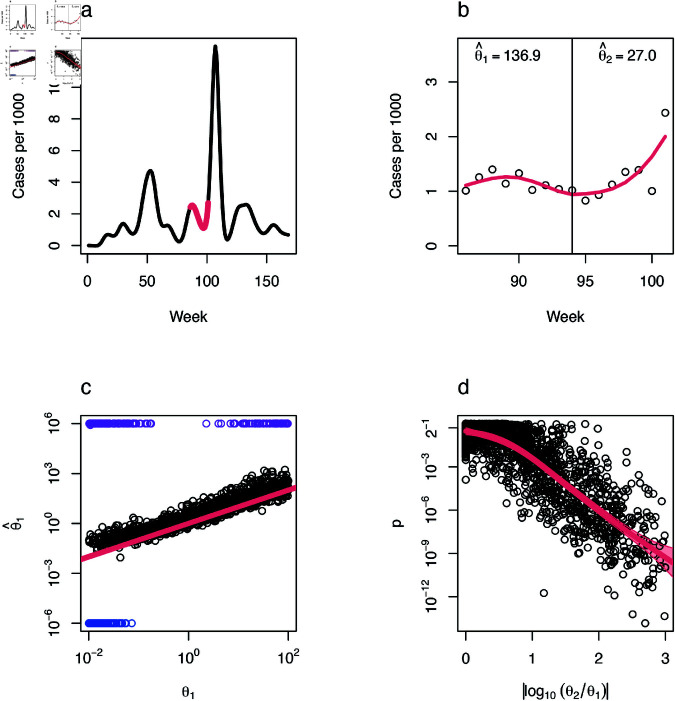
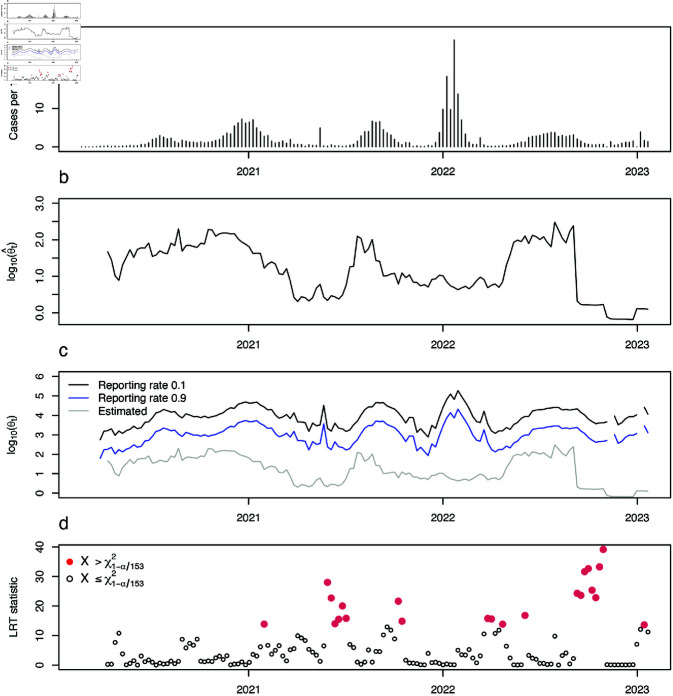
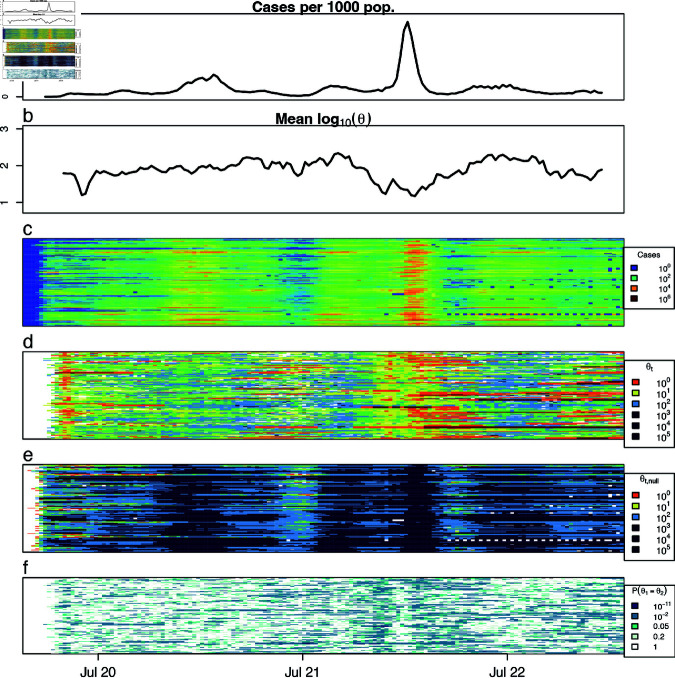
Trends in infectious disease incidence provide important information about epidemic dynamics and prospects for control. Higher-frequency variation around incidence trends can shed light on the processes driving epidemics in complex populations, as transmission heterogeneity, shifting landscapes of susceptibility, and fluctuations in reporting can impact the volatility of observed case counts. However, measures of temporal volatility in incidence, and how volatility changes over time, are often overlooked in population-level analyses of incidence data, which typically focus on moving averages. Here we present a statistical framework to quantify temporal changes in incidence dispersion and to detect rapid shifts in the dispersion parameter, which may signal new epidemic phases. We apply the method to COVID-19 incidence data in 144 United States (US) counties from January 1st, 2020 to March 23rd, 2023. Theory predicts that dispersion should be inversely proportional to incidence, however our method reveals pronounced temporal trends in dispersion that are not explained by incidence alone, but which are replicated across counties. In particular, dispersion increased around the major surge in cases in 2022, and highly overdispersed patterns became more frequent later in the time series. These increases potentially indicate transmission heterogeneity, changes in the susceptibility landscape, or that there were changes in reporting. Shifts in dispersion can also indicate shifts in epidemic phase, so our method provides a way for public health officials to anticipate and manage changes in epidemic regime and the drivers of transmission.


Conflict of interest statement

The authors have declared that no competing interests exist.

Figures

Fig 1
Fig 1. Detecting dispersion changes in case count time series.
a: Weekly incidence of COVID-19 in the United States, with time measured in weeks since January 4, 2020, showing an example of a randomly-selected 16-week period used as an incidence trend in simulation-based validation of the LRT test (red). b: Cases in one county (Douglas County, Nebraska) over the sample time period with estimated incidence trend (red) and estimated dispersion values on either side of the midpoint. c: Estimated θ1 versus true θ1 in simulation studies combining a randomly-selected section of the national incidence curve with a random population size and set of dispersion values. Estimated values outside of tolerance plotted in purple (close to Poisson) and blue (close to collapsing to zero), and a line with an intercept of zero and a slope of one plotted in red. d: Statistical power of the LRT test with smooth function (red line) and a 99.7% confidence interval for predicted p (red shading).
Fig 2
Fig 2. Dispersion analysis of weekly COVID-19 case data for Jefferson County, Alabama.
Results for all counties are shown in Fig 3. a: Weekly reported COVID-19 incidence. b: Estimated dispersion parameter (θ^t) over time. c: Comparison of estimated dispersion (gray) with predicted values from the standard model θt+1=Ct/ρt, where Ct is reported cases and ρt the reporting rate at time t. Predictions are shown for fixed ρt=0.1 (black) and ρt=0.9 (blue), chosen to encompass the range of θ expected under variable ρ. d: Likelihood ratio test (LRT) statistic over time. Statistically significant changes in dispersion (red) correspond to p-values below the Bonferroni-corrected 5% threshold of a chi-square distribution with one degree of freedom.
Fig 3
Fig 3. Incidence and dispersion between Jan 4, 2020 and March 18, 2023, in large counties in the US.
a: Mean COVID-19 cases of the 144 US counties over time (total cases over the counties divided by total population over the counties multiplied by 1,000). b: Mean log10θt of the 144 US counties over time. NAs produced by the method (see text) were removed from the average. c: log10(casest) over time for each of the 144 counties, where county is the y-axis. d: log10θt over time for each of the 144 counties. e: Expected value of log10θt under the null model, assuming a reporting rate of 0.5 for each county. f: LRT p-values over time for each county.

Similar articles

References

    1. Lloyd-Smith JO, Schreiber SJ, Kopp PE, Getz WM. Superspreading and the effect of individual variation on disease emergence. Nature. 2005;438(7066):355–9. doi: 10.1038/nature04153 - DOI - PMC - PubMed
    1. Lloyd-Smith JO. Maximum likelihood estimation of the negative binomial dispersion parameter for highly overdispersed data, with applications to infectious diseases. PLoS One. 2007;2(2):e180. doi: 10.1371/journal.pone.0000180 - DOI - PMC - PubMed
    1. Lau MSY, Dalziel BD, Funk S, McClelland A, Tiffany A, Riley S, et al. Spatial and temporal dynamics of superspreading events in the 2014-2015 West Africa Ebola epidemic. Proc Natl Acad Sci U S A. 2017;114(9):2337–42. doi: 10.1073/pnas.1614595114 - DOI - PMC - PubMed
    1. Dalziel BD, Kissler S, Gog JR, Viboud C, Bjørnstad ON, Metcalf CJE, et al. Urbanization and humidity shape the intensity of influenza epidemics in U.S. cities. Science. 2018;362(6410):75–9. doi: 10.1126/science.aat6030 - DOI - PMC - PubMed
    1. Kirkegaard JB, Sneppen K. Superspreading quantified from bursty epidemic trajectories. Sci Rep. 2021;11(1):24124. doi: 10.1038/s41598-021-03126-w - DOI - PMC - PubMed