. 2025 Jul 11;21(7):e1012395.
doi: 10.1371/journal.pcbi.1012395. eCollection 2025 Jul.

Allocating limited surveillance effort for outbreak detection of endemic foot and mouth disease

Affiliations

Allocating limited surveillance effort for outbreak detection of endemic foot and mouth disease

Ariel Greiner et al. PLoS Comput Biol. .

Abstract

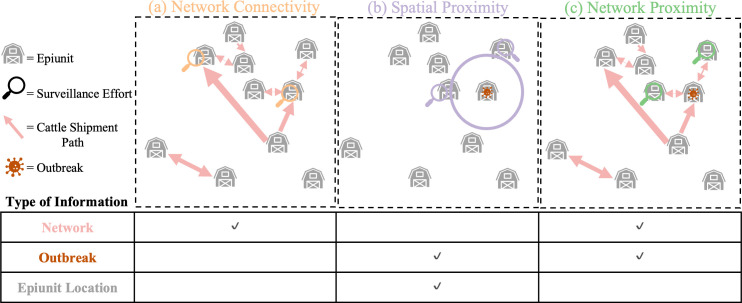
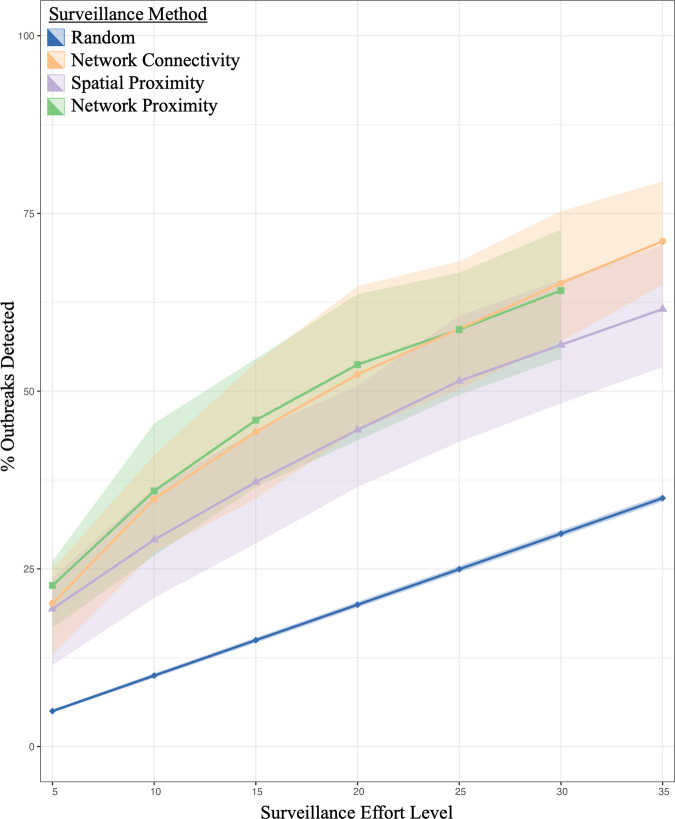
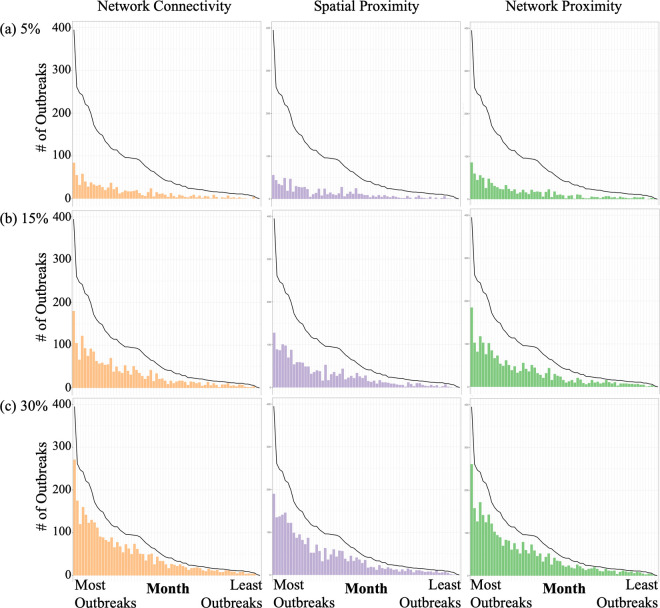
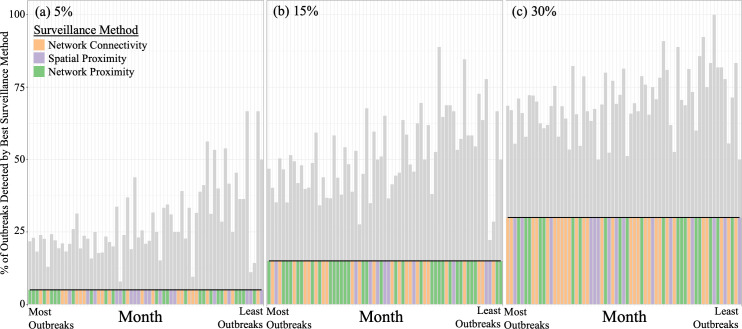
Foot and Mouth Disease (FMD) affects cloven-hoofed animals globally and has become a major economic burden for many countries around the world. Countries that have had recent FMD outbreaks are prohibited from exporting most meat products; this has major economic consequences for farmers in those countries, particularly farmers that experience outbreaks or are near outbreaks. Reducing the number of FMD outbreaks in countries where the disease is endemic is an important challenge that could drastically improve the livelihoods of millions of people. As a result, significant effort is expended on surveillance; but there is a concern that uninformative surveillance strategies may waste resources that could be better used on control management. Rapid detection through sentinel surveillance may be a useful tool to reduce the scale and burden of outbreaks. In this study, we use an extensive outbreak and cattle shipment network dataset from the Republic of Türkiye to retrospectively test three possible strategies for sentinel surveillance allocation in countries with endemic FMD and minimal existing FMD surveillance infrastructure that differ in their data requirements: ranging from low to high data needs, we allocate limited surveillance to [1] farms that frequently send and receive shipments of animals (Network Connectivity), [2] farms near other farms with past outbreaks (Spatial Proximity) and [3] farms that receive many shipments from other farms with past outbreaks (Network Proximity). We determine that all of these surveillance methods find a similar number of outbreaks - 2-4.5 times more outbreaks than were detected by surveying farms at random. On average across surveillance efforts, the Network Proximity and Network Connectivity methods each find a similar number of outbreaks and the Spatial Proximity method always finds the fewest outbreaks. Since the Network Proximity method does not outperform the other methods, these results indicate that incorporating both cattle shipment data and outbreak data provides only marginal benefit over the less data-intensive surveillance allocation methods for this objective. We also find that these methods all find more outbreaks when outbreaks are rare. This is encouraging, as early detection is critical for outbreak management. Overall, since the Spatial Proximity and Network Connectivity methods find a similar proportion of outbreaks, and are less data-intensive than the Network Proximity method, countries with endemic FMD whose resources are constrained could prioritize allocating sentinels based on whichever of those two methods requires less additional data collection.


Conflict of interest statement

The authors have declared that no competing interests exist.

Figures

Fig 1
Fig 1. Surveillance Methods Summary.
The three different data-informed surveillance methods are shown diagrammatically with an accompanying description of which types of information they are informed by. For each surveillance method, two magnifying glasses are shown on the epiunits that would have been selected by each surveillance method at a surveillance effort of 20% (2/10 epiunits). Epiunits with outbreaks on them in the diagram indicate epiunits with outbreaks with start dates in month t (i.e., ‘outbreak epiunits’). The circle in (b) indicates the search radius chosen at a surveillance effort of 20%. Note that ‘Network’ and ‘Outbreak’ information are dynamic and require consistent collection while ‘Epiunit Location’ information (the latitude and longitude of the centroid of the epiunit) is static and does not change over time. ‘Outbreak’ information is a record of the epiunit and start date of a particular outbreak. ‘Network’ information records the start and end epiunit of all cattle shipment events. Note that the ‘Network Connectivity’ surveillance method selects sites to survey without using the information in the outbreak dataset, but the outbreak dataset is used to assess whether the epiunits selected for surveillance by this method experienced an outbreak during the relevant time period (see the ‘Network Connectivity Method’ subsection of the ‘Surveillance Methods’ section for more details). Icons are from Microsoft Powerpoint and are free to use without royalty or copyright (https://support.microsoft.com/en-us/office/insert-icons-in-microsoft-365-e2459f17-3996-4795-996e-b9a13486fa79).
Fig 2
Fig 2. Performance of Surveillance Methods Across Surveillance Effort Levels.
The points represent the average percent of outbreaks each surveillance method detected across all t  + 1 months at each surveillance effort level (5-35%). The ribbons represent the variability across months (the interquartile range). The Network Proximity method is unable to survey over 30% of the epiunits for all of the two-month networks and so it is only plotted until the 30% surveillance effort level (as opposed to 35%).
Fig 3
Fig 3. Month-by-Month Surveillance Method Performance.
The bars in each panel show the number of outbreaks detected by each surveillance method at each surveillance effort level (5%, 15% 30% respectively) at each t  + 1 month. The black line shows the number of outbreaks reported in each t + 1 month. The t + 1 months are ordered by decreasing number of outbreaks, with the left-most month having the most outbreaks. Versions of these graphs that correspond to 10%, 20%, 25% and 35% surveillance effort levels are in the supplementary material (Fig F in S1 Text).
Fig 4
Fig 4. Best Surveillance Method Each Month.
Each panel shows the percent of outbreaks detected by the data-informed surveillance method that detected the most outbreaks in each t  + 1 month at each surveillance effort level. The bars indicate the percent of outbreaks detected by the best surveillance method and the horizontal black line indicates the percent of outbreaks detected by the Random surveillance method at that surveillance effort level. The coloured bars indicate the data-informed surveillance method that detected the most outbreaks at that surveillance effort level for that t + 1 month. The t + 1 months are ordered by declining number of outbreaks, with the left-most month having the most outbreaks. Versions of these graphs that correspond to 10%, 20%, 25% and 35% surveillance effort levels are in the supplementary material (Fig G in S1 Text).

Similar articles

References

    1. Alexandersen S, Zhang Z, Donaldson AI, Garland AJM. The pathogenesis and diagnosis of foot-and-mouth disease. J Comp Pathol. 2003;129(1):1–36. doi: 10.1016/s0021-9975(03)00041-0 - DOI - PubMed
    1. Veterinary Services UA. Foot-and-mouth disease response plan: The red book. 2020.
    1. James AD, Rushton J. The economics of foot and mouth disease. Revue scientifique et technique (International Office of Epizootics). 2003;21:637–44. - PubMed
    1. Knight-Jones TJD, Rushton J. The economic impacts of foot and mouth disease - what are they, how big are they and where do they occur?. Prev Vet Med. 2013;112(3–4):161–73. doi: 10.1016/j.prevetmed.2013.07.013 - DOI - PMC - PubMed
    1. Knight-Jones TJD, McLaws M, Rushton J. Foot-and-Mouth Disease Impact on Smallholders - What Do We Know, What Don’t We Know and How Can We Find Out More?. Transbound Emerg Dis. 2017;64(4):1079–94. doi: 10.1111/tbed.12507 - DOI - PMC - PubMed

MeSH terms