. 2025 Jul 11;11(28):eads3829.
doi: 10.1126/sciadv.ads3829. Epub 2025 Jul 11.

Exogenous activation of the adhesion GPCR ADGRD1/GPR133 protects against bone loss by negatively regulating osteoclastogenesis

Affiliations

Exogenous activation of the adhesion GPCR ADGRD1/GPR133 protects against bone loss by negatively regulating osteoclastogenesis

Liang He et al. Sci Adv. .

Abstract

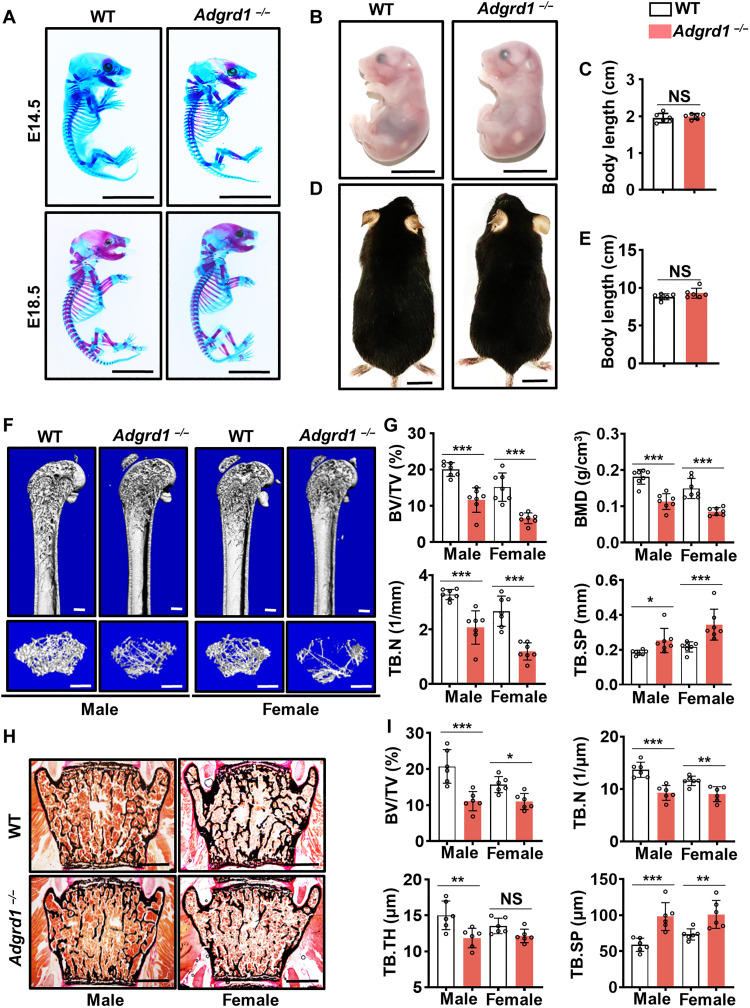
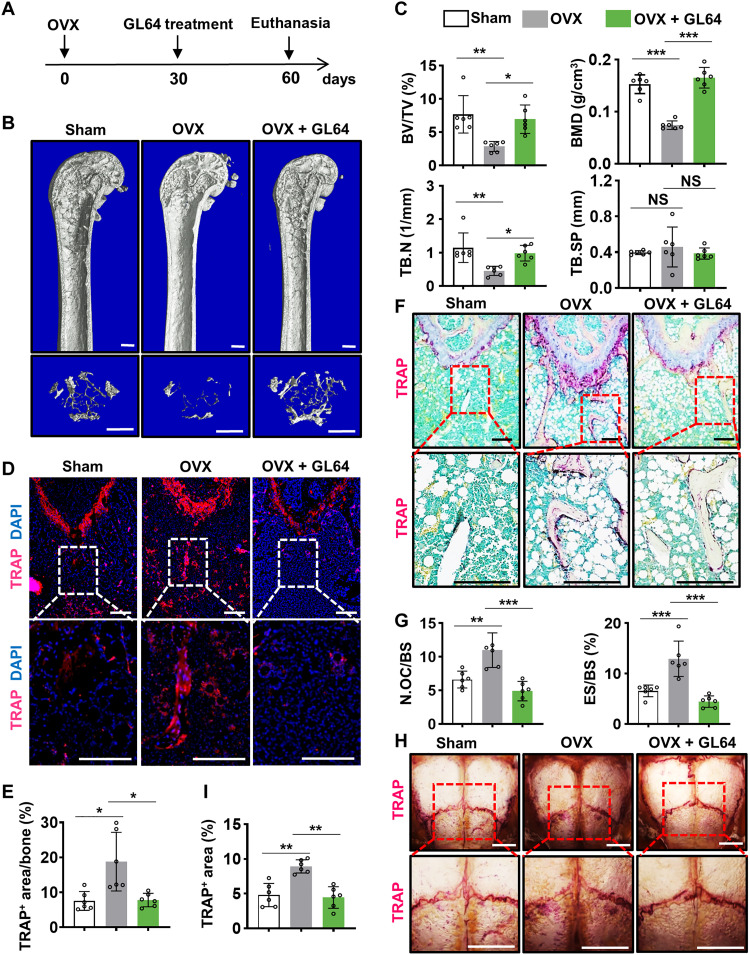
Adhesion G protein-coupled receptors (GPCRs) play crucial roles in numerous physiological and pathological conditions. However, the functions of adhesion GPCRs remain poorly understood because of the lack of effective modulators. Here, we used the adhesion GPCR D1 (ADGRD1/GPR133) as a model to unveil a strategy for finding exogenous agonists that target adhesion GPCRs while revealing previously unidentified functions of ADGRD1. We identified the small molecule GL64 as a selective agonist of ADGRD1. GL64 activates ADGRD1 by mimicking the stachel sequence. Using GL64 as a chemical tool, we demonstrated that ADGRD1 negatively regulates bone loss by inhibiting osteoclastogenesis. The cAMP-PKA-NFATC1 pathway was identified as the downstream signaling pathway of ADGRD1 in osteoclasts. Furthermore, administering GL64 prevented bone loss and suppressed osteoclast activity in the osteoporosis mouse model induced by ovariectomy. Our findings provide mechanistic insights into the activation of adhesion GPCRs by exogenous agonists and underscore the therapeutic potential of targeting ADGRD1 in osteoclast-related diseases.


Figures

Fig. 1.
Fig. 1.. GL64 was identified as a selective agonist of ADGRD1 in vitro.
(A) Illustration of the process used to identify specific agonists of ADGRD1. (B) Relative CRE-luciferase expression in vector control and ADGRD1-overexpressing HEK293T cells after treatment with a series of compounds (10 μM). Each column was compared with the ADGRD1-overexpressing control column (F5,12 = 12.80, P = 0.0002). The data are presented as the means ± SD. ***P < 0.001. Two independent biological replicates were performed. (C) Chemical structure of GL64. (D) Relative CRE-luciferase expression in WT and Adgrd1−/− MEFs treated with GL64 (10 μM) (F3,9 = 22.41, P = 0.0002). The data are presented as the means ± SD. **P < 0.01; NS, not significant. Three independent biological replicates were performed. (E) Endogenous cAMP concentration in WT and Adgrd1−/− MEFs treated with GL64 (30 μM) (F3,3 = 52.10, P = 0.0044). The data are presented as the means ± SD. *P < 0.05. Two independent biological replicates were performed. (F) Concentration-response curves of ADGRD1 in response to stimulation with GL64. The data are presented as the means ± SD. The values are shown as the average of two experiments. (G) Detailed interaction between GL64 and ADGRD1. The GL64 molecule is shown as a slate stick, and the key residue side chains of ADGRD1 are shown as deep teal sticks. (H) Alanine mutagenesis scanning of putative residues in the ADGRD1 ligand binding pocket on GL64-induced cAMP inhibition in a CRE-luciferase assay (F1,9 = 9.129, P = 0.0144). The data are presented as the means ± SD. *P < 0.05, **P < 0.01, and ***P < 0.001. Two independent biological replicates were performed.
Fig. 2.
Fig. 2.. Potential activation mechanisms of the GL64 molecule in ADGRD1 from MD simulations.
(A) RMSD of the small molecule GL64 during three independent 1-μs MD simulations for the GL64-ADGRD1 complex. Sim, simulation. (B) Structural representation of the interaction of GL64 with ADGRD1 according to MD simulations. The values were calculated on the basis of the final snapshot of the 1-μs MD simulation. GL64 is represented by purple sticks, and key residues are shown as blue sticks. (C) Time evolution of the distance changes between W7736.53 and Q7987.49 during three independent 1-μs MD simulations in ADGRD1 with GL64. (D) Time evolution of the distance changes between W7736.53 and Q7987.49 during three independent 1-μs MD simulations in ADGRD1 without GL64. (E) Detailed interactions between W7736.53 and Q7987.49 in the ADGRD1-GL64 complex (the final MD snapshot), apo state ADGRD1 (the final MD snapshot), and ADGRD1 with the stachel segment (cryo-EM structure).
Fig. 3.
Fig. 3.. Bone phenotype of Adgrd1-deficient mice.
(A) Representative alcian blue and alizarin red staining images of whole skeletal preparations from WT and Adgrd1−/− mice at embryonic day 14.5 (E14.5) and embryonic day 18.5 (E18.5). Scale bars, 1 cm. (B) Representative images of WT and Adgrd1−/− mice at P0. Scale bars, 1 cm. (C) The body length (nose-to-tail) was measured and compared between WT and Adgrd1−/− mice at P0. The data are presented as the means ± SD. n = 6. (D) Representative images of WT and Adgrd1−/− mice at postnatal week 8. Scale bars, 1 cm. (E) The body length (nose-to-tail) was measured and compared between WT and Adgrd1−/− mice at postnatal week 8. The data are presented as the means ± SD. n = 6. (F) Representative micro-CT images of the femurs of 8-week-old WT and Adgrd1−/− mice showing the distal femur (top; scale bars, 500 μm) and trabeculae (bottom; scale bars, 200 μm). (G) Quantitative micro-CT analysis of the trabecular bone parameters of the femurs shown in (F) (BV/TV: F3,18 = 31.04, P < 0.0001; BMD: F3,18 = 28.83, P < 0.0001; TB. N: F3,18 = 28.68, P < 0.0001; TB. SP: F3,18 = 16.12, P < 0.0001). The data are presented as the means ± SD. *P < 0.05 and ***P < 0.001. n = 7. (H) Representative images of von Kossa staining of vertebral sections from 8-week-old WT and Adgrd1−/− mice. Scale bars, 500 μm. (I) Trabecular bone parameters were compared between the WT and Adgrd1−/− mice shown in (H) (BV/TV: F3,15 = 16.59, P < 0.0001); TB. N: F3,15 = 25.96, P < 0.0001; TB.TH: F3,15 = 7.058, P = 0.0035; TB. SP: F3,15 =14.92, P < 0.0001). The data are presented as the means ± SD. *P < 0.05, **P < 0.01, and ***P < 0.001. n = 6.
Fig. 4.
Fig. 4.. Osteoclastogenesis is promoted in Adgrd1-deficient mice.
(A) Representative immunofluorescence images of TRAP-stained femurs from 8-week-old male WT and Adgrd1−/− mice. Scale bars, 100 μm. (B) Percentage of TRAP-positive areas in the bone samples shown in (A). The data are presented as the means ± SD. ***P < 0.001; n = 6. (C) Representative TRAP staining images of femur osteoclasts from 8-week-old male WT and Adgrd1−/− mice. Scale bars, 100 μm. (D) Quantification of femur osteoclasts from the 8-week-old WT and Adgrd1−/− mice shown in (C). The data are presented as the means ± SD. *P < 0.05 and **P < 0.01; n = 6. (E) Representative image of TRAP staining of the calvarias of 8-week-old male WT and Adgrd1−/− mice. Scale bars, 1 mm. (F) Percentage of TRAP-positive areas in the calvarias of the samples shown in (E). The data are presented as the means ± SD. ***P < 0.001; n = 6. (G) Representative TRAP staining images of calvarias from 8-week-old male WT and Adgrd1−/− mice. Scale bars, 100 μm. (H) Parameters of calvarial osteoclastogenesis in 8-week-old WT and Adgrd1−/− mice. The data are presented as the means ± SD. *P < 0.05 and ***P < 0.001; n = 6.
Fig. 5.
Fig. 5.. Knocking out Adgrd1 in osteoclasts decreases bone mass by promoting osteoclastogenesis.
(A) Representative micro-CT images of the distal (top; scale bars, 500 μm) and trabecular (bottom; scale bars, 200 μm) femurs of 8-week-old Adgrd1f/f and Adgrd1Lysm mice. (B) Quantitative micro-CT analysis of trabecular bone parameters in the femurs of 8-week-old Adgrd1f/f and Adgrd1Lysm mice (BV/TV: F3,21 = 9.590, P = 0.0003; BMD: F3,21 = 7.283, P = 0.0016; TB. N: F3,21 = 7.082, P = 0.0018). The data are presented as the means ± SD. *P < 0.05 and **P < 0.01. n = 8. (C) Representative images of TRAP-stained femurs from 8-week-old male Adgrd1f/f and Adgrd1Lysm mice. Scale bars, 100 μm. (D) Percentage of TRAP-positive areas in the bone samples shown in (C). The data are presented as the means ± SD. **P < 0.01; n = 6. (E) Representative TRAP-stained images of femoral osteoclasts from 8-week-old male Adgrd1f/f and Adgrd1Lyzm mice. Scale bars, 100 μm. (F) Quantification of parameters in the 8-week-old male Adgrd1f/f and Adgrd1Lyzm mice shown in (E). The data are presented as the means ± SD. **P < 0.01 and ***P < 0.001; n = 6. (G) Representative TRAP staining of calvarias from 8-week-old male Adgrd1f/f and Adgrd1Lysm mice. Scale bars, 1 mm. (H) Percentage of TRAP-positive areas in calvarias shown in (G). The data are presented as the means ± SD. ***P < 0.001; n = 6. (I) Representative TRAP staining images of calvarias from 8-week-old male Adgrd1f/f and Adgrd1Lysm mice. Scale bars, 100 μm. (J) Parameters of osteoclastogenesis in the calvarias of 8-week-old male Adgrd1f/f and Adgrd1Lysm mice. The data are presented as the means ± SD. **P < 0.01; n = 6.
Fig. 6.
Fig. 6.. Adgrd1 knockout in BMM cells promotes osteoclast differentiation and bone resorption.
(A) Representative TRAP staining images of cells cultured with M-CSF and RANKL for 2, 4, or 6 days isolated from WT and Adgrd1−/− male mice. Scale bars, 100 μm. (B) Quantification of the osteoclast area and number of the cells shown in (A) (area: F7,14 = 227.6, P < 0.0001; number: F7,14 = 696.8, P < 0.0001). The data are presented as the means ± SD. ***P < 0.001. Three independent biological replicates were performed. (C) Representative TRAP staining images of WT and Adgrd1−/− BMMs cultured with M-CSF (10 ng/ml) and varying RANKL concentrations. Scale bars, 100 μm. (D) Quantification of osteoclast area and number from the samples shown in (C) (area: F7,14 = 170.0, P < 0.0001; number: F7,14 = 130.6, P < 0.0001). The data are presented as the means ± SD. **P < 0.01 and ***P < 0.001. Three independent biological replicates were performed. (E) Representative confocal microscopy images of hydroxyapatite resorption by osteoclasts derived from WT and Adgrd1−/− male mice. Scale bars, 10 μm. (F) Quantification of bone resorption area and depth in the samples shown in (E). The data are presented as the means ± SD. **P < 0.01 and ***P < 0.001. Three independent biological replicates were performed. (G) Representative SEM images of hydroxyapatite resorption by osteoclasts isolated from WT and Adgrd1−/− male mice. Scale bars, 20 μm. (H) Representative TRAP staining images of WT and Adgrd1−/− BMMs treated with RANKL (100 ng/ml) or GL64 (10 μM) for 6 days. Scale bars, 50 μm. (I) Quantification of the osteoclast area and number of the cells shown in (H) (area: F3,6 = 26.13, P = 0.0008; number: F3,6 = 50.43, P = 0.0001). The data are presented as the means ± SD. *P < 0.05, **P < 0.01, and ***P < 0.001. Three independent biological replicates were performed.
Fig. 7.
Fig. 7.. GL64/ADGRD1 regulates osteoclast maturation through the cAMP-PKA-NFATC1 pathway.
(A) Intracellular cAMP levels in WT BMM cells after induction with RANKL (100 ng/ml), DMSO, or GL64 (30 μM). The data are presented as the means ± SD. **P < 0.01. Two independent biological replicates were performed. (B) Intracellular cAMP levels in vector- and ADGRD1-overexpressing RAW264.7 cells. The data are presented as the means ± SD. *P < 0.05. Four independent biological replicates were performed. (C) Representative images of TRAP staining of BMMs treated with DMSO, GL64 (10 μM), or H89 (1 μM) and stimulated with RANKL (100 ng/ml) for 6 days. Scale bars, 50 μm. (D) Quantification of osteoclast area and number shown in (C) (area: F3,6 = 45.34, P = 0.0002; number: F3,6 = 69.20, P < 0.0001). The data are presented as the means ± SD. **P < 0.01 and ***P < 0.001. Three independent biological replicates were performed. (E) Representative TRAP staining images of WT and Adgrd1−/− BMMs treated with RANKL (100 ng/ml) or IBMX (50 μM) for 6 days. Scale bars, 50 μm. (F) Quantification of the osteoclast area (top) and number (bottom) of the cells shown in (E) (area: F3,6 = 30.08, P = 0.0005; number: F3,6 = 291.4, P < 0.0001). The data are presented as the means ± SD. *P < 0.05 and ***P < 0.001. Three independent biological replicates were performed. (G) Representative images of NFATC1 nuclear translocation in BMM cells treated with DMSO, GL64 (10 μM), or H89 (1 μM) and stimulated with RANKL (100 ng/ml) for 2 days. Scale bars, 50 μm. (H) Percentage of NFATC1 nuclear localization in the samples shown in (G) (F3,6 = 34.52, P = 0.0004). Data are presented as the means ± SD. *P < 0.05. Three independent biological replicates were performed.
Fig. 8.
Fig. 8.. GL64 rescues OVX-induced bone loss and osteoclast hyperactivity.
(A) Schematic diagram showing the experimental design for GL64 treatment in OVX-induced osteoporosis mice. (B) Representative micro-CT images of the distal femur (top; scale bars, 500 μm) and trabecula (bottom; scale bars, 200 μm) after 1 month of GL64 treatment in the OVX-induced mouse model. (C) Quantitative micro-CT analysis of trabecular bone parameters from the samples shown in (B) (BV/TV: F2,10 = 9.656, P = 0.0046; BMD: F2,10 = 44.34, P < 0.0001; TB. N: F2,10 = 10.02, P = 0.0041). The data are presented as the means ± SD. *P < 0.05, **P < 0.01, and ***P < 0.001. n = 6. (D) Representative immunofluorescence images of TRAP-stained femurs from OVX-induced mice treated with GL64 for 1 month. Scale bars, 100 μm. (E) Percentage of TRAP-positive areas in the bone samples shown in (D). The data are presented as the means ± SD (F2,10 = 7.906, P = 0.0087). *P < 0.05. n = 6. (F) Representative TRAP staining images of femur osteoclasts in the OVX-induced mouse model after 1 month of GL64 treatment. Scale bars, 100 μm. (G) Parameters of the femur osteoclasts shown in (F) (N. OC/B: F2,10 = 27.49, P < 0.0001; ES/BS: F2,10 = 30.28, P < 0.0001). The data are presented as the means ± SD. **P < 0.01 and ***P < 0.001. n = 6. (H) Representative TRAP staining images of calvarias from OVX-induced mice after 1 month of GL64 treatment. Scale bars, 1 mm. (I) Percentage of TRAP-positive areas in calvarias from the samples shown in (H) (F2,10 = 16.30, P = 0.0007). The data are presented as the means ± SD. **P < 0.01. n = 6.

Similar articles

References

    1. Lu M., Wu B., Structural studies of G protein-coupled receptors. IUBMB Life 68, 894–903 (2016). - PubMed
    1. Hauser A. S., Attwood M. M., Rask-Andersen M., Schiöth H. B., Gloriam D. E., Trends in GPCR drug discovery: New agents, targets and indications. Nat. Rev. Drug Discov. 16, 829–842 (2017). - PMC - PubMed
    1. NIH Consensus Development Panel on Osteoporosis Prevention, Diagnosis, and Therapy , Osteoporosis prevention, diagnosis, and therapy. JAMA 285, 785–795 (2001). - PubMed
    1. Kapolka N. J., Taghon G. J., Rowe J. B., Morgan W. M., Enten J. F., Lambert N. A., Isom D. G., DCyFIR: A high-throughput CRISPR platform for multiplexed G protein-coupled receptor profiling and ligand discovery. Proc. Natl. Acad. Sci. U.S.A. 117, 13117–13126 (2020). - PMC - PubMed
    1. Hua M., Peluffo G., Chen H., Gelman R., Schnitt S., Polyak K., Role of COX-2 in epithelial-stromal cell interactions and progression of ductal carcinoma in situ of the breast. Proc. Natl. Acad. Sci. U.S.A. 106, 3372–3377 (2009). - PMC - PubMed

MeSH terms

Substances