. 2025 Jul 11;11(28):eadu5915.
doi: 10.1126/sciadv.adu5915. Epub 2025 Jul 11.

Complex I inhibition combined with TLR activation in the breast tumor microenvironment educates cytotoxic neutrophils

Affiliations

Complex I inhibition combined with TLR activation in the breast tumor microenvironment educates cytotoxic neutrophils

John Heath et al. Sci Adv. .

Abstract

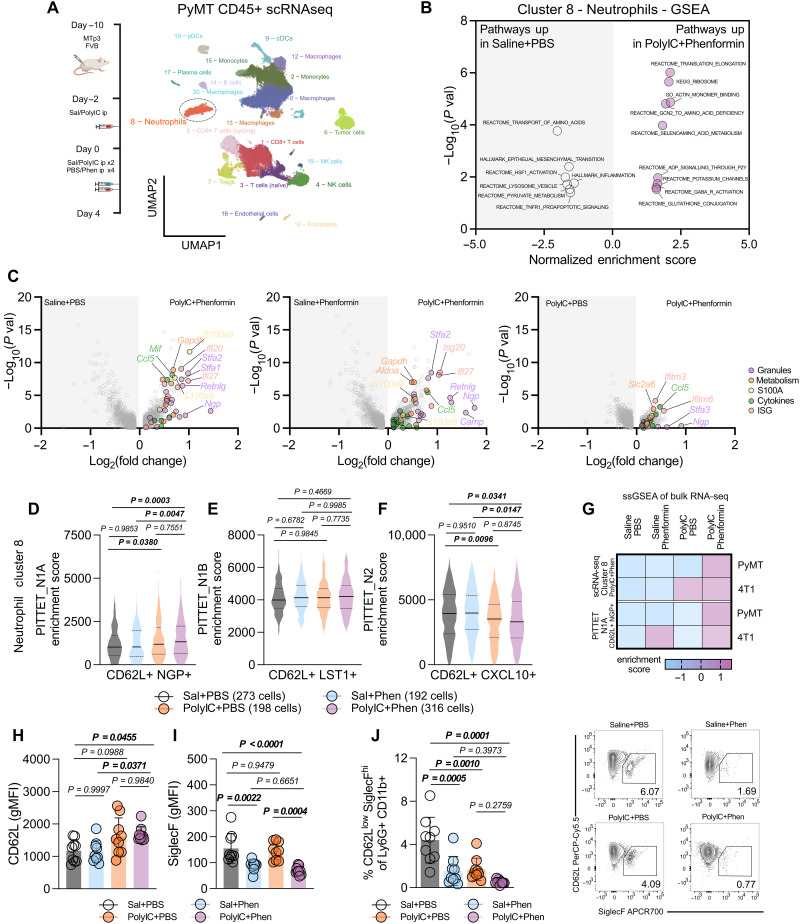
Although effective for immunologically hot tumors, immune checkpoint inhibitors minimally affect tumors that are not T cell inflamed, including breast cancer. An alternate strategy to combat immune cold breast tumors may be to reeducate innate immunity. This study identifies strategies to skew neutrophils to acquire tumoricidal properties. Systemic Toll-like receptor (TLR)-induced inflammation, concomitant with mitochondrial complex I inhibition in breast tumors, increases neutrophil cytotoxicity against breast cancer cells and independently of CD8+ T cell immunity. These therapy-entrained neutrophils enhance secretory granule production, increasing expression of the reduced form of nicotinamide adenine dinucleotide phosphate (NADPH) oxidase machinery and inducing a respiratory burst. Moreover, systemic administration of TLR agonists elevates nuclear factor κB signaling in neutrophils to increase production of secretory granule and NADPH oxidase machinery components, whereas complex I inhibitors are required to potentiate oxidative damage. In summary, we describe a class of neutrophils, educated by the combined action of inflammatory mediators and metabolic inhibitors, having tumoricidal functions.


Figures

Fig. 1.
Fig. 1.. The antitumorigenic properties of complex I inhibitors associate with innate inflammation.
Mammary fat pad (MFP) injection of (A) PyMT or (B) 4T1 cells into FVB or BALB/c mice, respectively. Mice were treated with vehicle, polyIC, and/or phenformin [average tumor volume (mm3) ± SEM: PyMT (n = 8 to 11); 4T1 (n = 9 to 12)]. RNA-seq analysis of (C) PyMT or (D) 4T1 tumors (n = 4 per group). PCA was performed. Volcano plots of the most differentially expressed genes for the (E) PyMT and (G) 4T1 tumors [log2(1.5); false discovery rate < 0.05]. GSEA for the most differentially expressed pathways for the (F) PyMT and (H) 4T1 tumors. (I) MFP injection of 4T1 cells into BALB/c mice. Cohorts were treated with vehicle or polyIC/phenformin. Two days prior to tumor inoculation, cohorts were injected with CD8 neutralizing antibodies or the isotype control (50 μg), which continued every 2 days [average tumor volume (mm3) ± SEM (n = 8 tumors per group)]. h, hours. (J) Average tumor mass at the endpoint. (K) MFP injection of PyMT cells into FVB mice. Cohorts were treated with vehicle or polyIC/phenformin. At the start of treatment, cohorts were injected with PD1 neutralizing antibodies or the isotype control (50 μg), which was continued every 3 days [average tumor volume (mm3) ± SEM (n = 7 to 11 tumors per group)]. (L) Average tumor mass at the endpoint. FACS analysis of the percentage of infiltrating Ly6G+/CD11b+ neutrophils (normalized to CD45+ cells) into (M) 4T1 and (N) PyMT tumors (n = 8 per group). P values were calculated using a one-way analysis of variance (ANOVA) with a Tukey’s post hoc test [(A), (B), and (I) to (N)].
Fig. 2.
Fig. 2.. Neutrophils are associated with antitumorigenic phenotypes following combination treatment.
(A) scRNA-seq analysis of infiltrating CD45+ cells isolated from control-, polyIC-, and/or phenformin-treated PyMT tumors (n = 2 tumors each) UMAP space. (B) GSEA of differentially expressed genes from the following pairwise comparisons: control versus polyIC/phenformin (n = 2687 genes); phenformin versus polyIC/phenformin (n = 2614 genes); polyIC versus polyIC/phenformin (n = 2227 genes). (C) Volcano plots in cluster 8 (neutrophils) of differentially expressed genes. (D to F) ssGSEA of differentially expressed genes for the abundance of unique neutrophil states within cluster 8 as follows: (D) N1A–CD62L+/NGP+, (E) N1B–CD62L+/LST1+, and (F) N2–CD62L+/CXCL10. The number of cells used within each treatment group of cluster 8 is outlined. (G) Heatmap of relative ssGSEA scores from bulk RNA-seq data (Fig. 1) using two neutrophil gene signatures associated with good outcome, including differentially expressed genes between polyIC/phenformin- and control-treated neutrophils (cluster 8) or the N1A neutrophil signature. (H to J) FACS analysis for the mean fluorescence intensity (MFI) of cell surface (H) CD62L or (I) SiglecF levels on tumor-infiltrating CD11b+/Ly6G+ neutrophils and (J) the percentage of tumor-infiltrating CD62LLow/SiglecFHi neutrophils in control or treated 4T1 tumors (nine tumors per group). P values were calculated using a one-way ANOVA with a Tukey’s post hoc test [(D) to (F) and (H) to (J)].
Fig. 3.
Fig. 3.. Cytotoxic neutrophils exert therapy-induced antitumorigenic functions.
Pearson correlation of the percentage of tumor-infiltrating (A and B) Ly6G+ granulocytes or (C and D) Ly6C+ myeloid cells within control- or polyIC/phenformin-treated (A and C) PyMT or (B and D) 4T1 tumors relative to endpoint tumor volumes (mm3) (12 to 16 tumors per group). (E and F) Coculture of CD11b+/Ly6G+ neutrophils isolated from (E) the blood or (F) tumors of 4T1 tumor-bearing mice and 4T1 cells in vitro (10:1 ratio) (10 mice per group). (G to J) 4T1 tumor-bearing mice were treated with vehicle or polyIC/phenformin and either Ly6G neutralizing antibodies or the isotype control (50 μg), and (G) circulating Ly6G+ cells were quantified at the endpoint. (H) Tumor growth rates were measured (average tumor volume (mm3) ± SEM; 6 to 14 tumors per group). (I) Tumor mass and (J) spleen weight at the endpoint. (K) G-CSF levels secreted from PyMT cells expressing an empty vector (EV) or overexpressing G-CSF (Csf3) were quantified from cell lysates or conditioned media by enzyme-linked immunosorbent assay (ELISA) (n = 3). (L) S100A8 immunohistochemical analysis of PyMT (EV) and PyMT (Csf3) mammary tumors (n = 8). (M) PyMT-Csf3 tumor-bearing mice were treated with vehicle, polyIC, and/or phenformin [average tumor volume (mm3) ± SEM (8 to 10 tumors per group)]. (N) Average tumor mass and (O) spleen weight. (P) FACS quantification of Ly6G+/CD11b+ neutrophils or (Q) as a fraction of CD45+ immune cells from the blood. P values were calculated using a one-way ANOVA with a Tukey’s post hoc test [(E), (F), (H) to (J), and (M) to (Q)] or a two-tailed Student’s t test [(K) and (L)].
Fig. 4.
Fig. 4.. Combination therapy restrains metastatic seeding and systemic niche colonization.
4T1 tumors were treated with vehicle or polyIC/phenformin and resected at 500 mm3. The (A) average tumor volume and (B) % tumor-bearing mice during the time course are shown along with the time point at which tumors were resected (control: black line; polyIC/phen: pink line). (C) Drug treatment was terminated at resection, and the lung metastatic burden was quantified 21 days later. Representative H&E-stained lung sections are shown. The data in (A) to (C) are representative of 10 to 13 mice per group. (D) Mice were injected intravenously with 4T1 cells and treated 10 days later with vehicle or polyIC/phenformin for 11 days and lung metastatic burden was quantified (n = 9 to 10 mice per group). Representative H&E lung sections are shown. (E) Mice were injected intracranially with 4T1 cells and treated with vehicle or polyIC/phenformin 1 day postimplantation. The intracranial tumor volume was calculated by MRI. Representative MRI scans and H&E sections are shown. The data are representative of five mice per group, and (F) circulating Ly6G+/CD11b+ neutrophils were quantified. P values were calculated using a two-tailed Student’s t test [(C) to (E)].
Fig. 5.
Fig. 5.. NF-κB signaling is associated with neutrophil-mediated antitumor immunity.
(A) Cytokine bead array of inflammatory cytokines in tumor lysates from tumor-bearing mice treated with vehicle, polyIC, and/or phenformin (n = 5 to 8 mice per group). Selected NF-κB targets (IL-1β, IL-6, and TNF) are shown as fold change relative to vehicle-treated controls. Untransformed data are available in fig. S9. (B) Relative enrichment score for NF-κB pathway genes within the bulk RNA-seq data from PyMT and 4T1 tumors. (C) Immunoblot analysis of tumor lysates with phospho-S536 and total p65 NF-κB antibodies. β-Actin serves as the loading control. (D) Schematic diagram illustrating TLR9 agonists that preferentially activate type I IFN/IRF signaling (class A: ODN1585) or NF-κB signaling (class B: ODN1826). (E) 4T1 tumor-bearing mice were treated with vehicle+/− phenformin, ODN1585+/− phenformin, or ODN1826+/− phenformin [average tumor volume (mm3) ± SEM (n = 9 to 12 tumors per group)]. (F) Tumor mass and (G) FACS quantification of circulating Ly6G+CD11b+ neutrophils at the endpoint. FACS quantification of pNF-κB (Ser536) levels in Ly6G+/CD11b+ circulating neutrophils from (H) 4T1 or (I) AT3 tumor-bearing mice (n = 4 to 6 mice per group). P values were calculated using a one-way ANOVA with a Tukey’s post hoc test [(E) to (I)]. n.s., not significant.
Fig. 6.
Fig. 6.. TLR4 signaling potentiates neutrophil-mediated antitumor immunity.
MFP injection of 4T1 cells into (A) BALB/c or (D) SCID-Beige mice. Tumor-bearing mice were treated with vehicle, phenformin, and/or CRX-527 (average tumor volume (mm3) ± SEM; 10 to 12 tumors per group). (B and E) Tumor mass for the (B) BALB/c or (E) SCID-Beige cohorts. (C and F) Circulating Ly6G+/CD11b+ cells were quantified from tumor-bearing (C) BALB/c or (F) SCID-Beige mice at the endpoint. (G) MFP injection of AT3 cells into TLR+/+ or TLR4−/− mice. Tumor-bearing mice were treated with vehicle, polyIC, and/or phenformin (average tumor volume (mm3) ± SEM; 8 to 10 tumors per group). (H) Tumor mass and (I) circulating Ly6G+/CD11b+ cells at the endpoint. (J) Coculture of control and therapy-entrained neutrophils isolated from TLR+/+ and TLR4−/− mice with AT3 cells (5:1 ratio) (n = 4 mice each). E:T, effector:target. (K) Relative pNF-κB (Ser536) levels were measured in Ly6G+/CD11b+ circulating neutrophils by flow cytometry (4 to 5 tumor-bearing mice per group). P values were calculated using a one-way ANOVA with a Tukey’s post hoc test.
Fig. 7.
Fig. 7.. Inflammatory signaling in antitumorigenic neutrophils drives granulopoiesis and NAPDH oxidase synthesis.
(A) PCA analysis and (B) relative enrichment score of proteomics data obtained from 4T1 tumor-infiltrating neutrophils isolated from mice treated with vehicle, phenformin, and/or polyIC (n = 4 per group). (C) Volcano plots showing pairwise comparisons highlighting secretory granule and NADPH oxidase components, S100A8 proteins, and inflammatory mediators that are the most differentially expressed. Heatmap showing the most differentially expressed proteins representing (D) granule components or (E) the NADPH oxidase machinery. (F and G) Relative enrichment score for NF-κB pathway genes within the proteomes of neutrophils isolated from the blood or tumors of 4T1 tumor-bearing mice. Quantification of the number of MPO+ (left) or S100A8+ (right) granules in neutrophils isolated from the bloodstream of (H) 4T1 or (I) AT3 tumor-bearing mice. For (I), neutrophils were isolated from TLR4+/+ and TLR4−/− animals. A minimum of 50 neutrophils were counted among three biological replicates. Representative immunofluorescent images are shown. P values were calculated using a one-way ANOVA with a Tukey’s post hoc test [(H) and (I)].
Fig. 8.
Fig. 8.. Oxidative stress underlies the ability of therapy-entrained neutrophils to exert cytotoxic phenotypes.
(A) Coculture of neutrophils isolated from control- or therapy-treated 4T1 tumor-bearing mice with 4T1 cells (5:1 ratio). Cocultures were treated with phenformin (0.25 mM), verdiperstat (4 nM), or FPS-ZM1 (6 nM) (n = 8 per group). HBSS, Hanks’ balanced salt solution. (B) DHE and (C) DCFDA levels (% positive cells and mean fluorescence intensity) from blood Ly6G+/CD11b+ neutrophils isolated from 4T1 tumor-bearing mice treated with vehicle, polyIC, and/or phenformin (five to eight tumors per group). (D) ROS production from PMA-stimulated neutrophils isolated from 4T1 tumor-bearing mice. Before PMA stimulation, neutrophils were treated with vehicle, MPO inhibitor (MPOi) (verdiperstat) or recombinant SOD3. In vivo ROS levels in (E) 4T1 and (F) AT3 tumor-bearing mice treated with vehicle, phenformin, and/or polyIC (six to eight tumors per group). (G) 4T1 tumor-bearing mice were treated with vehicle, phenformin, and/or polyIC, and cohorts received verdiperstat (5 mg) or DMSO [average tumor volume (mm3) ± SEM (n = 9 to 12 tumors per group)]. (H) Tumor mass and (I) in vivo ROS levels at the endpoint. (J) SOD3 levels produced from tumor lysates or secreted into the conditioned media of empty vector and SOD3-overexpressing 4T1 cells as measured by ELISA (n = 3). (K) 4T1 (EV and SOD3-overexpressing) tumor-bearing mice were treated with vehicle, phenformin, and/or polyIC (average tumor volume (mm3) ± SEM; n = 10 to 12 tumors per group). (L) Tumor mass and (M) in vivo ROS levels at the endpoint. P values were calculated using a one-way ANOVA with a Tukey’s post hoc test [(B), (C), (E), (F), (G) to (I), and (K) to (M)] or a two-tailed Student’s t test [(A) and (J)]. RLU, relative light units.
Fig. 9.
Fig. 9.. TLR inducers and complex I inhibitors collaboratively engage a TME that educates tumoricidal neutrophils.
TLR-mediated activation in the breast tumor and/or metastatic microenvironment acts, either directly or indirectly, on neutrophils to up-regulate expression of secretory granule components, including MPO, along with the NAPDH oxidase machinery. The coordinate action of complex I inhibitors, either directly or indirectly, then primes a respiratory burst on TLR-activated neutrophils to elicit tumoricidal responses.

Similar articles

References

    1. Dagogo-Jack I., Shaw A. T., Tumour heterogeneity and resistance to cancer therapies. Nat. Rev. Clin. Oncol. 15, 81–94 (2018). - PubMed
    1. de Visser K. E., Joyce J. A., The evolving tumor microenvironment: From cancer initiation to metastatic outgrowth. Cancer Cell 41, 374–403 (2023). - PubMed
    1. DeBerardinis R. J., Keshari K. R., Metabolic analysis as a driver for discovery, diagnosis, and therapy. Cell 185, 2678–2689 (2022). - PMC - PubMed
    1. Tong L., Chuang C. C., Wu S., Zuo L., Reactive oxygen species in redox cancer therapy. Cancer Lett. 367, 18–25 (2015). - PubMed
    1. Greten F. R., Grivennikov S. I., Inflammation and cancer: Triggers, mechanisms, and consequences. Immunity 51, 27–41 (2019). - PMC - PubMed

MeSH terms