. 2025 Jul 11;11(28):eads5467.
doi: 10.1126/sciadv.ads5467. Epub 2025 Jul 11.

Cypin regulates K63-linked polyubiquitination to shape synaptic content

Affiliations

Cypin regulates K63-linked polyubiquitination to shape synaptic content

Srinivasa R Gandu et al. Sci Adv. .

Abstract

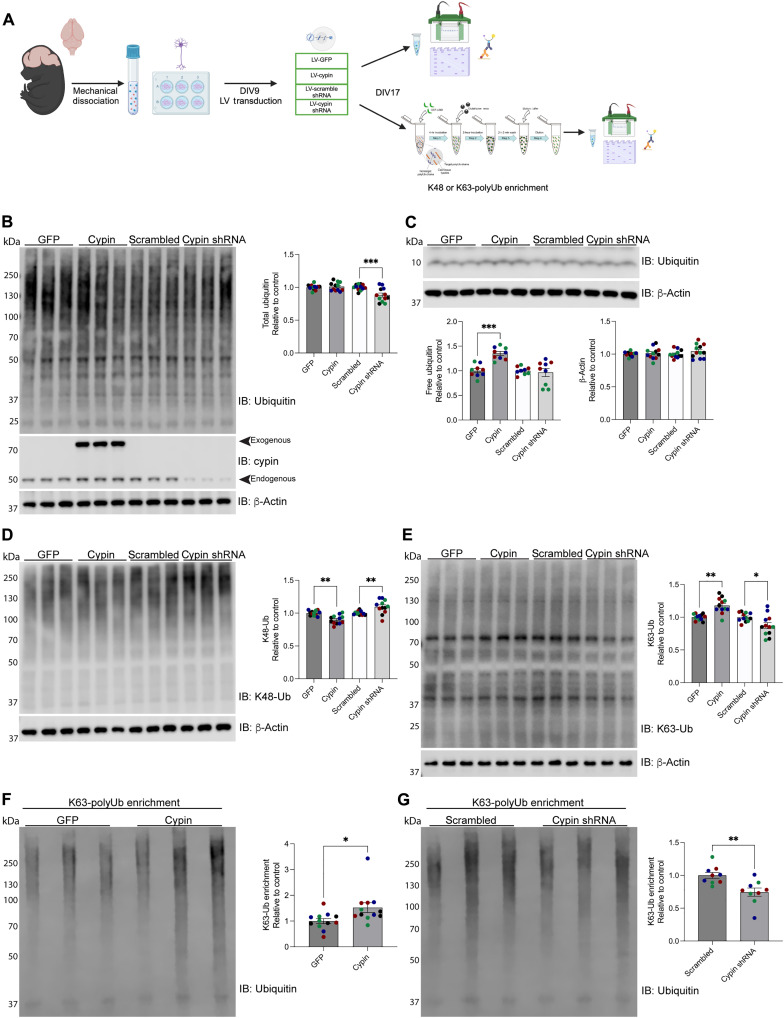
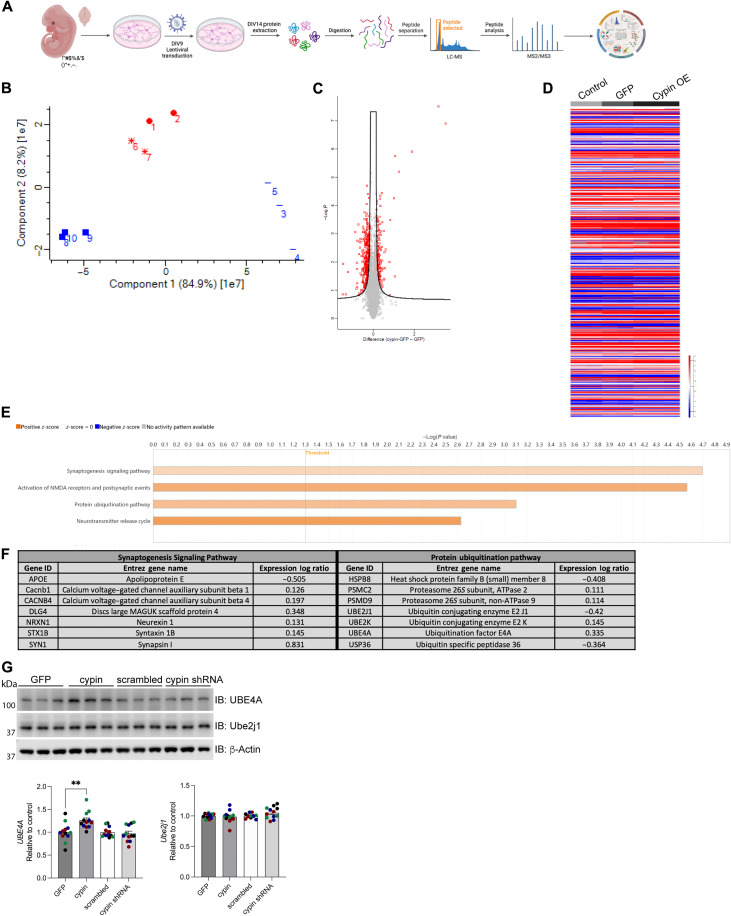
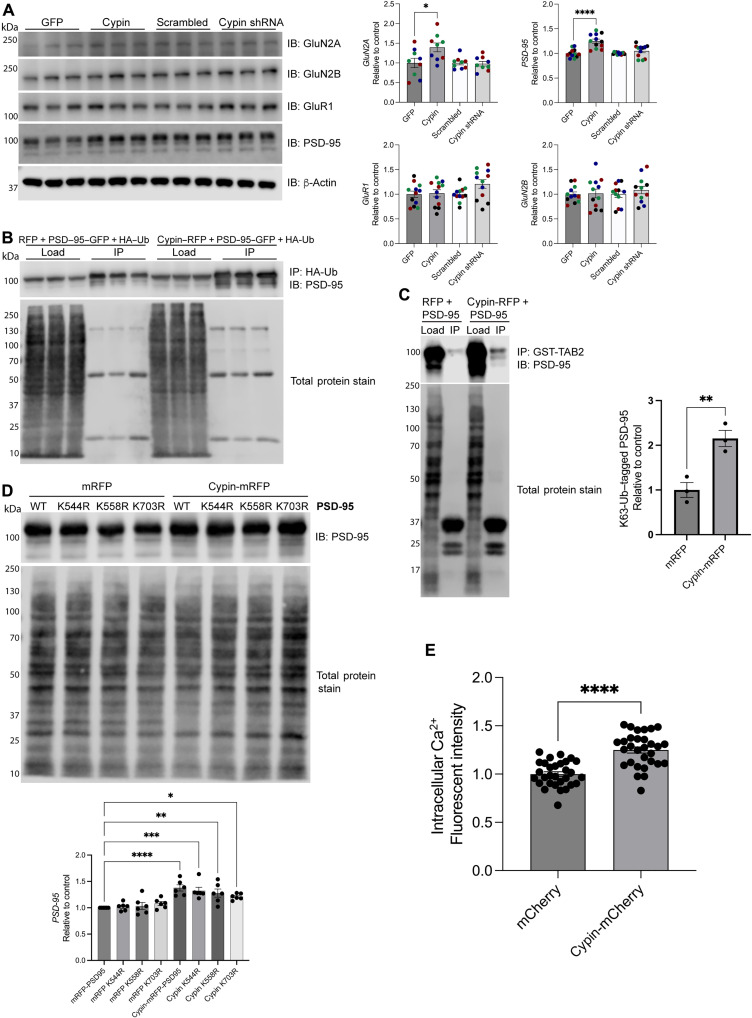
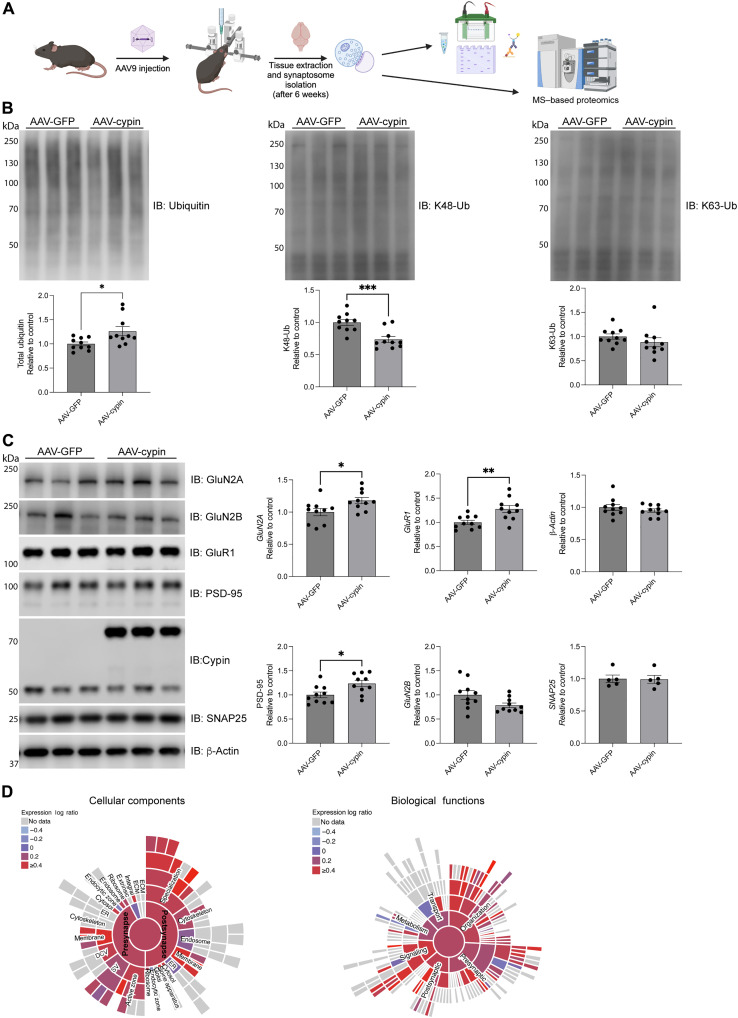
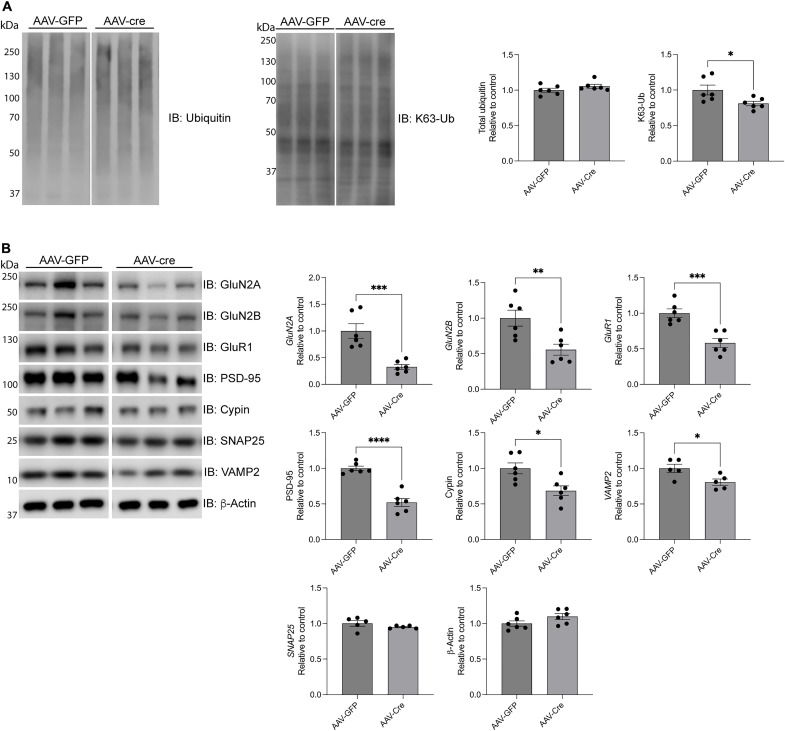
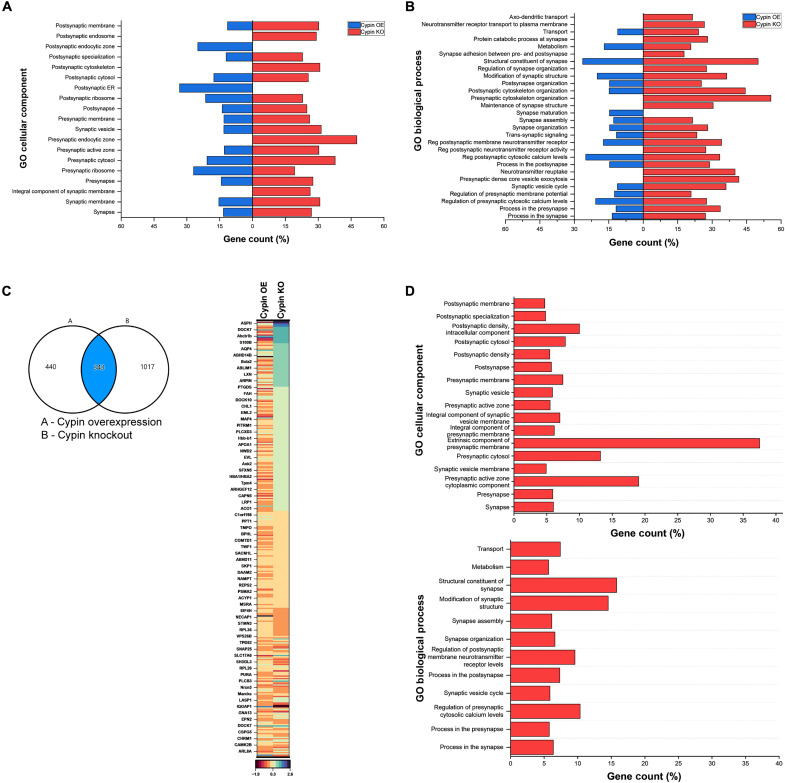
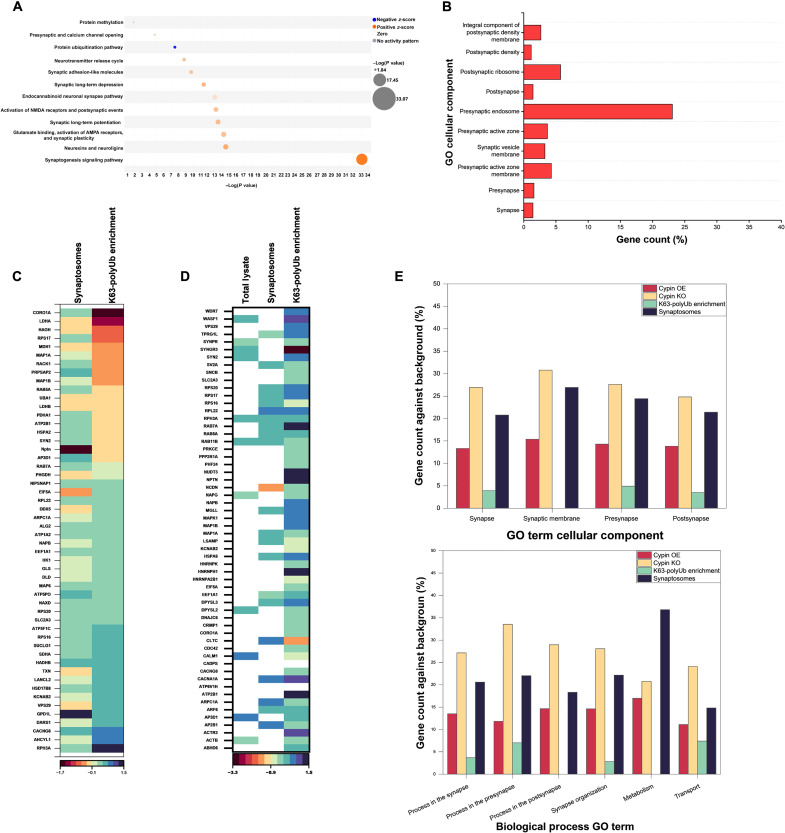
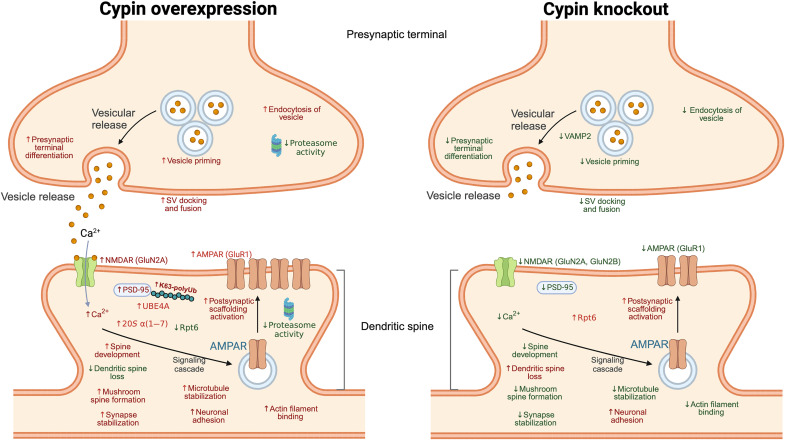
An open question in neuroscience is how protein posttranslational modifications regulate synaptic site targeting. Polyubiquitination plays a role in proteasome-mediated protein turnover; however, additional functions for specific types of polyubiquitin linkages have been identified. One type of polyubiquitination, K63-polyubiquitin (K63-polyUb), has been studied for its role in signal transduction within the context of cancer, but little has been done to uncover its role regarding neuronal and synaptic function. Here, we report an emerging function for the cytosolic PSD-95 interactor, cypin, in the regulation of synaptic content by K63-polyUb during neuronal development in vitro and in adult mice in vivo. We identify cypin-promoted K63-polyUb on postsynaptic proteins and also find an important role for cypin in presynaptic function. Our work demonstrates that cypin-promoted changes to K63-polyUb can regulate synaptic content and function on both sides of the synapse, adding important insight into basic mechanisms of neuronal signaling.


Figures

Fig. 1.
Fig. 1.. Cypin promotes K63-linked polyubiquitination in developing neurons.
(A) Schematic of the experimental design (B and C) Western blot analysis of total ubiquitin and free ubiquitin levels in extracts of primary rat cortical cultures with cypin overexpression (n = 9 to 12 culture wells) or knockdown (n = 9 to 12 culture wells). Levels of total Ub, free ubiquitin, and β-actin normalized to total protein stain (TPS) and GFP (control for overexpression) or scrambled shRNA (scramble; control for knockdown). GST-UBD, glutathione S-transferase–tagged ubiquitin-binding domains. (D and E) Western blot analysis of K48-polyUb and K63-polyUb levels in extracts of primary rat cortical cultures with cypin overexpression (n = 12 culture wells) or knockdown (n = 12 culture wells). Levels of K48-polyUb or K63-polyUb are normalized to TPS and GFP or scrambled. (F and G) K63-polyUb chain capture and subsequent Western blot analysis of total Ub in extracts of primary rat cortical neuronal cultures with cypin overexpression (n = 9 to 12 culture wells) or knockdown (n = 9 to 12 culture wells). K48-polyUb or K63-polyUb levels normalized to TPS and GFP or scramble. *P < 0.05, **P < 0.01, and ***P < 0.001 compared to control as determined by one-way ANOVA followed by Tukey’s multiple comparisons test [(A) to (D)] or two-tailed Student’s t test [(E) and (F)]. Note that experiments in (E) and (F) were performed and run separately and, thus, analyzed separately. Wells from neuronal cultures from the same mother are represented as black, red, green, or blue. Mean ± SEM is shown for all graphs. LV, lentivirus; IB, immunoblot. Schematic created in BioRender. Gandu, S. (2025) https://BioRender.com/g92x639.
Fig. 2.
Fig. 2.. Cypin increases UBE4A levels and promotes K63 polyubiquitination in developing neurons.
(A) Schematic representation of experimental workflow used to identify changes in the proteome with cypin overexpression in primary rat cortical cultures transduced with lentiviral particles encoding GFP (control) or cypin-GFP. (B) Principal components analysis shows clusters of similarity within replicates but not between experimental conditions. Red circles (1 and 2), untransfected; blue dash (3 to 5), epoxomicin treated; red asterisks (6 and 7), GFP; blue squares (8 to 10), cypin-GFP. (C) Volcano plot showing significantly regulated molecules with cypin overexpression versus GFP (Ctrl). Four hundred twenty-nine proteins were identified to be significantly different with cypin overexpression. (D) Heatmap of cypin overexpression (OE)–mediated changes in the proteome. (E and F) Functional analysis of proteins in (D) using IPA uncovers the synaptogenesis signaling and protein ubiquitination pathways as the top two altered pathways with cypin overexpression. UBE4A is up-regulated with cypin overexpression. MAGUK, membrane-associated guanylate kinase; ATPase, adenosine triphosphatase. (G) Western blot analysis of UBE4A and UBE2J1 levels in extracts of primary rat cortical cultures with cypin overexpression (n = 12 culture wells) or knockdown (n = 12 culture wells). UBE4A and UBE2J1 levels are normalized to GFP or scrambled shRNA (scrambled). **P < 0.01 compared to control as determined by one-way ANOVA followed by Tukey’s multiple comparisons test. Wells from neuronal cultures from the same mother are represented as black, red, green, or blue. Mean ± SEM is shown for all graphs. β-Actin serves as a negative control. Schematic created in BioRender. Gandu, S. (2025) https://BioRender.com/ldrwnhp.
Fig. 3.
Fig. 3.. Cypin regulates synaptic protein levels and K63 polyubiquitination of PSD-95 in vitro.
(A) Western blot analysis of GluN2A, GluN2B, GluR1, PSD-95, and β-actin levels in extracts of primary rat cortical cultures with cypin overexpression (n = 12 culture wells) or knockdown (n = 12 culture wells). Protein levels are normalized to TPS and GFP or scrambled shRNA (scrambled). β-Actin serves as a negative control. (B) Coimmunoprecipitation (co-IP) of HA-Ub and PSD-95–GFP from extracts of HEK293T cells expressing mRFP (n = 3 independent replicates) or cypin-mRFP (n = 3 independent replicates). (C) Western blot analysis of eluates from K63-polyubiquitin chain capture from HEK293T cells coexpressing mRFP (n = 3 independent replicates) or cypin-mRFP (n = 3 independent replicates) and PSD-95–GFP. K63-polyUb levels are normalized to TPS, where the immunoglobulin G (IgG) bands of the antibody used in the co-IPs is detected and then to mRFP control. (D) Western blot analysis of PSD-95 levels in lysates from HEK293T cells overexpressing mRFP (n = 3 independent replicates) or cypin-mRFP (n = 3 independent replicates) and PSD-95–GFP (WT), PSD-95–GFP–K544R (impairs K48- and K63-polyUb), PSD-95–GFP–K558R (impairs K63-polyUb), or PSD-95–GFP–K703R (impairs K48-polyUb). Protein levels are normalized to TPS and mRFP. (E) Intracellular Ca2+ levels were measured using detection of Fluo-4 fluorescence in neurons overexpressing mCherry (n = 30 independent replicates) or cypin-mCherry (n = 30 independent replicates). *P < 0.05, **P < 0.01, and ****P < 0.0001 versus respective control as determined by one-way ANOVA followed by Tukey’s multiple comparisons test (A) or two-tailed Student’s t test [(C) and (D)]. Wells from neuronal cultures from the same mother are represented black, red, green, or blue. Mean ± SEM is shown for all graphs.
Fig. 4.
Fig. 4.. Cypin overexpression regulates synaptic content in vivo.
(A) Schematic representation of experimental workflow. (B) Western blot analysis of levels of total Ub, K48-polyUb, and K63-polyUb in lysates of synaptosomes isolated from the dorsal hippocampus of mice overexpressing GFP (AAV-GFP; n = 5 or 10 animals) or cypin-GFP (AAV-cypin; n = 5 or 10 animals). Protein levels are normalized levels to TPS and GFP. (C) Western blot analysis of GluN2A, GluN2B, GluR1, PSD-95, SNAP25, and β-actin levels in lysates of synaptosomes isolated from the dorsal hippocampus of mice overexpressing GFP or cypin-GFP. Protein levels are normalized levels to TPS where the IgG bands of the antibody used in the co-IPs is detected and then to GFP control. β-Actin serves as a negative control. (D) Cypin overexpression–mediated changes to the proteome analyzed for cellular components and biological functions of synapses (n = 7 animals for each group). *P < 0.05, **P < 0.01, and ***P < 0.001 versus GFP control as determined by two-tailed Student’s t test [(A) and (B)]. Mean ± SEM is shown for all graphs. n = number of mice. Schematic created in BioRender. Gandu, S. (2025) https://BioRender.com/i09q340. ECM, extracellular matrix; ER, endoplasmic reticulum. DCV, dense core vesicles; SV, synaptic vesicles.
Fig. 5.
Fig. 5.. Cypin knockout regulates synaptic content in vivo.
(A) Western blot analysis of levels of total ubiquitin and K63-polyUb in lysates of synaptosomes isolated from the dorsal hippocampus of cypin knockout mice, resulting from injection of AAV-cre into cypinflox/flox mice (AAV-cre). Total ubiquitin and K63-polyUb levels are normalized to TPS and GFP (AAV-GFP; n = 5 to 6 animals per group). (B) Western blot analysis of levels of GluN2A, GluN2B, GluR1, PSD-95, SNAP25, VAMP2, cypin, and β-actin levels in lysates of synaptosomes isolated from the dorsal hippocampus of mice expressing GFP or cre. Protein levels are normalized to TPS and GFP. *P < 0.05, **P < 0.01, ***P < 0.001, and ****P < 0.0001 as determined by two-tailed Student’s t test. Samples where cypin knockout was less than 25%, as described in Materials and Methods, were excluded from the analysis. Mean ± SEM is shown for all graphs. n = number of mice. β-Actin serves as a negative control.
Fig. 6.
Fig. 6.. Altered cypin expression results in changes to the synaptic proteome in vivo.
(A and B) Functional analysis of cellular components and biological processes at the synapse identified with significantly regulated genes from mass spectrometry analysis from total lysates of dorsal hippocampus of mice with cypin overexpression (n = 7 animals per group) or knockout (n = 6 animals per group). (C) Comparison (left) and heatmap (right) analyses of genes encoding proteins regulated with both cypin overexpression (OE) and knockout (KO) (missing values are represented by white color). (D) GSEA of genes encoding proteins regulated with both cypin overexpression and knockout and mapped into the cellular component (top) and biological process (bottom) pathways at the synapse. Abundances were normalized to respective controls (GFP for cypin overexpression and AAV-GFP for knockout) to generate the fold change of expression. Significant molecules were identified by P < 0.05 as determined by Student’s t test of fold change values.
Fig. 7.
Fig. 7.. Cypin regulates K63 polyubiquitination proteome at synapses in vivo.
(A) IPA showing activation in orange (z-score > 2) or inhibition in blue (z-score < −2) of pathways altered with cypin overexpression in isolated synaptosomes. (B) GSEA of genes encoding proteins changed in both synaptosomes (n = 7 animals per group) and K63-polyUb–enriched (n = 4 animals per group) samples with cypin overexpression. Genes are mapped into the cellular components of the synapse. (C and D) Heatmaps showing fold change of expression of common significantly regulated genes in both synaptosomes and K63-polyubiquitin enrichment fractions (C), and total lysate, synaptosomes, and K63-polyUb–enriched fractions (D) from mice with cypin overexpression (missing values are represented by white color). (E) Synaptic genes annotated against cellular components and biological process ontology terms from cypin overexpression (total lysate, synaptosomes, and K63-polyUb enriched) and cypin knockout samples. SynGo ontology terms with corrected P < 0.05 were included in the analysis. Abundances were normalized to respective controls (GFP for cypin overexpression and AAV-GFP for knockout) to generate fold change of expression. P values were determined by the Student’s t test.
Fig. 8.
Fig. 8.. Model of the effects of cypin-regulated K63 polyubiquitination of the synaptic proteome.
Model for the effects of cypin based on the data from Western blot analysis and mass spectrometry analysis. Cypin regulates the expression of synaptic proteasome subunits, K63-polyUb of both pre- and postsynaptic proteins, and UBE4A protein levels. In turn, the abundance of synaptic proteins changes, including PSD-95, glutamate receptor subunits, and presynaptic proteins. As a result, synaptic signaling at both pre- and postsynaptic sites is modulated. Schematic created in BioRender. Gandu, S. (2025) https://BioRender.com/c40z366. NMDAR, NMDA receptor; AMPAR, AMPA receptor.

Similar articles

References

    1. Kennedy M. B., Synaptic signaling in learning and memory. Cold Spring Harb. Perspect. Biol. 8, a016824 (2016). - PMC - PubMed
    1. Cohen L. D., Zuchman R., Sorokina O., Muller A., Dieterich D. C., Armstrong J. D., Ziv T., Ziv N. E., Metabolic turnover of synaptic proteins: Kinetics, interdependencies and implications for synaptic maintenance. PLOS ONE 8, e63191 (2013). - PMC - PubMed
    1. Soykan T., Haucke V., Kuijpers M., Mechanism of synaptic protein turnover and its regulation by neuronal activity. Curr. Opin. Neurobiol. 69, 76–83 (2021). - PubMed
    1. Yi J. J., Ehlers M. D., Ubiquitin and protein turnover in synapse function. Neuron 47, 629–632 (2005). - PubMed
    1. Sheng M., Hoogenraad C. C., The postsynaptic architecture of excitatory synapses: A more quantitative view. Annu. Rev. Biochem. 76, 823–847 (2007). - PubMed

LinkOut - more resources