. 2025 Jul 11:10.1158/0008-5472.CAN-24-3819.
doi: 10.1158/0008-5472.CAN-24-3819. Online ahead of print.

RIT1 Drives Oncogenic Transformation and is an Actionable Target in Lung Adenocarcinoma

Affiliations

RIT1 Drives Oncogenic Transformation and is an Actionable Target in Lung Adenocarcinoma

Alessandro M Mozzarelli et al. Cancer Res. .

Abstract

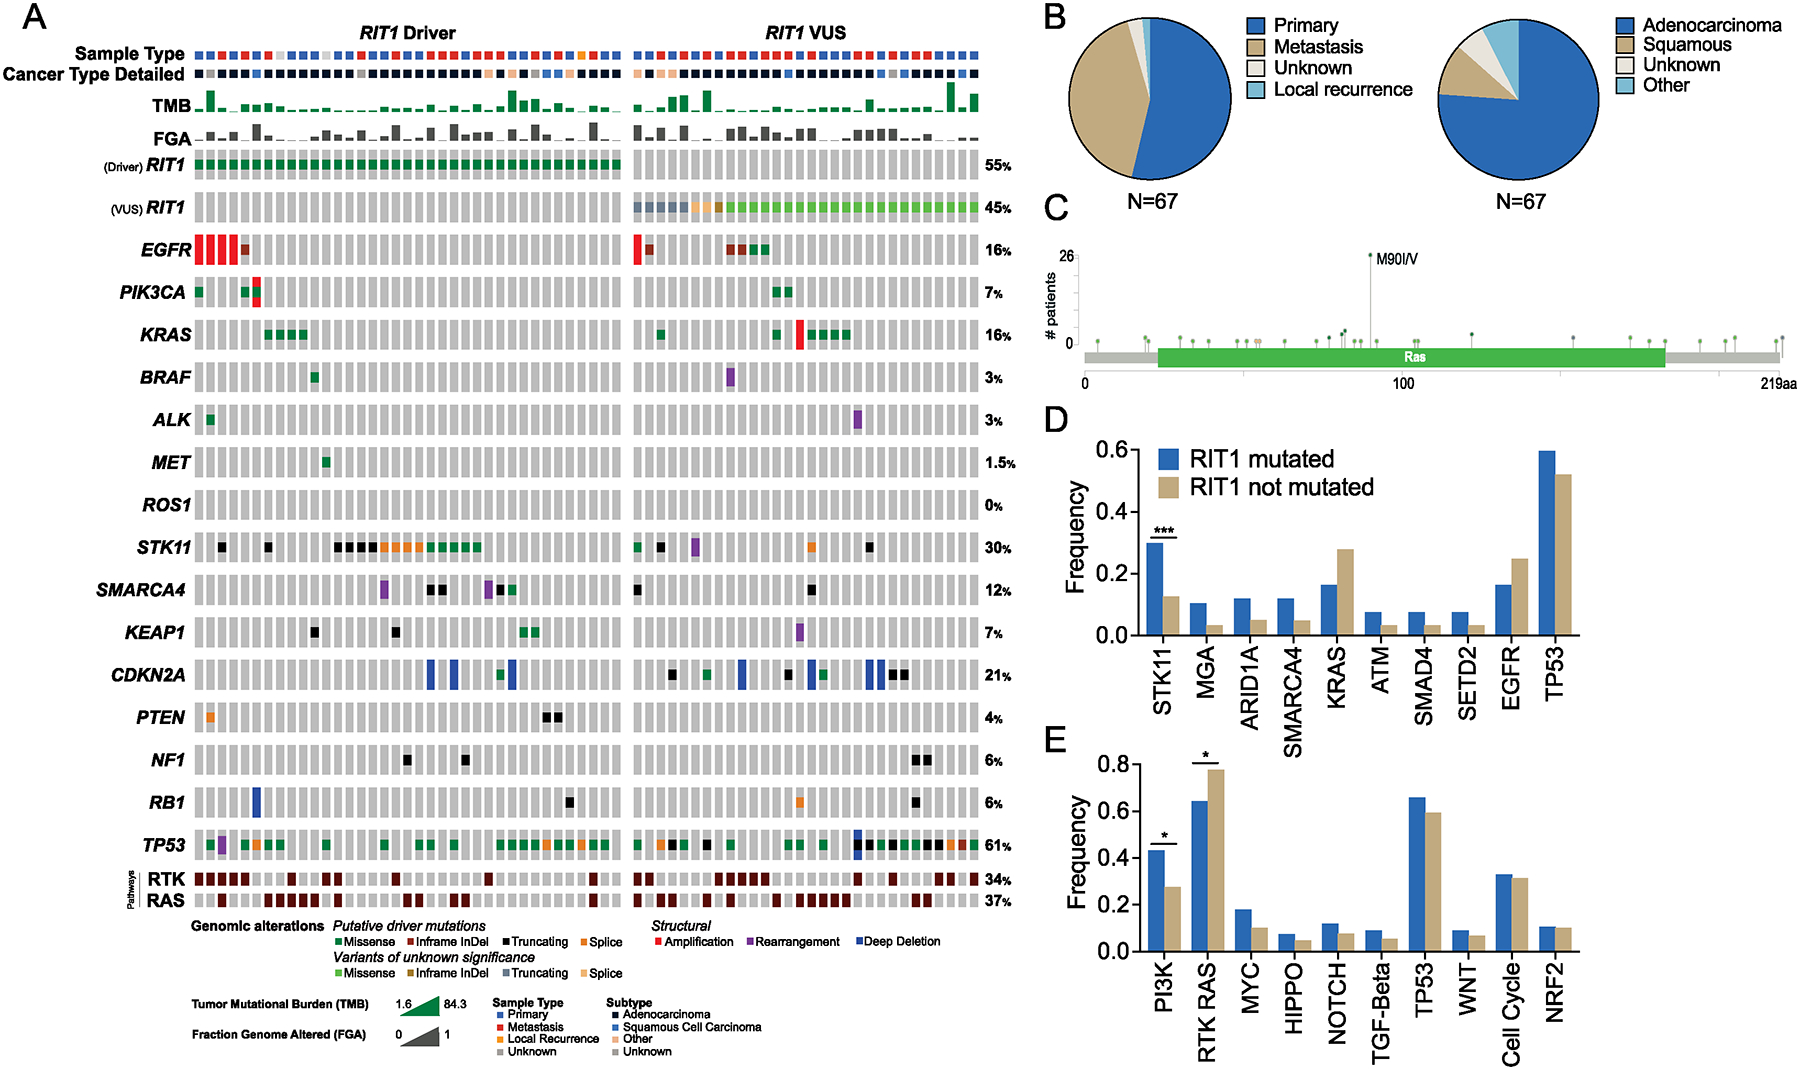
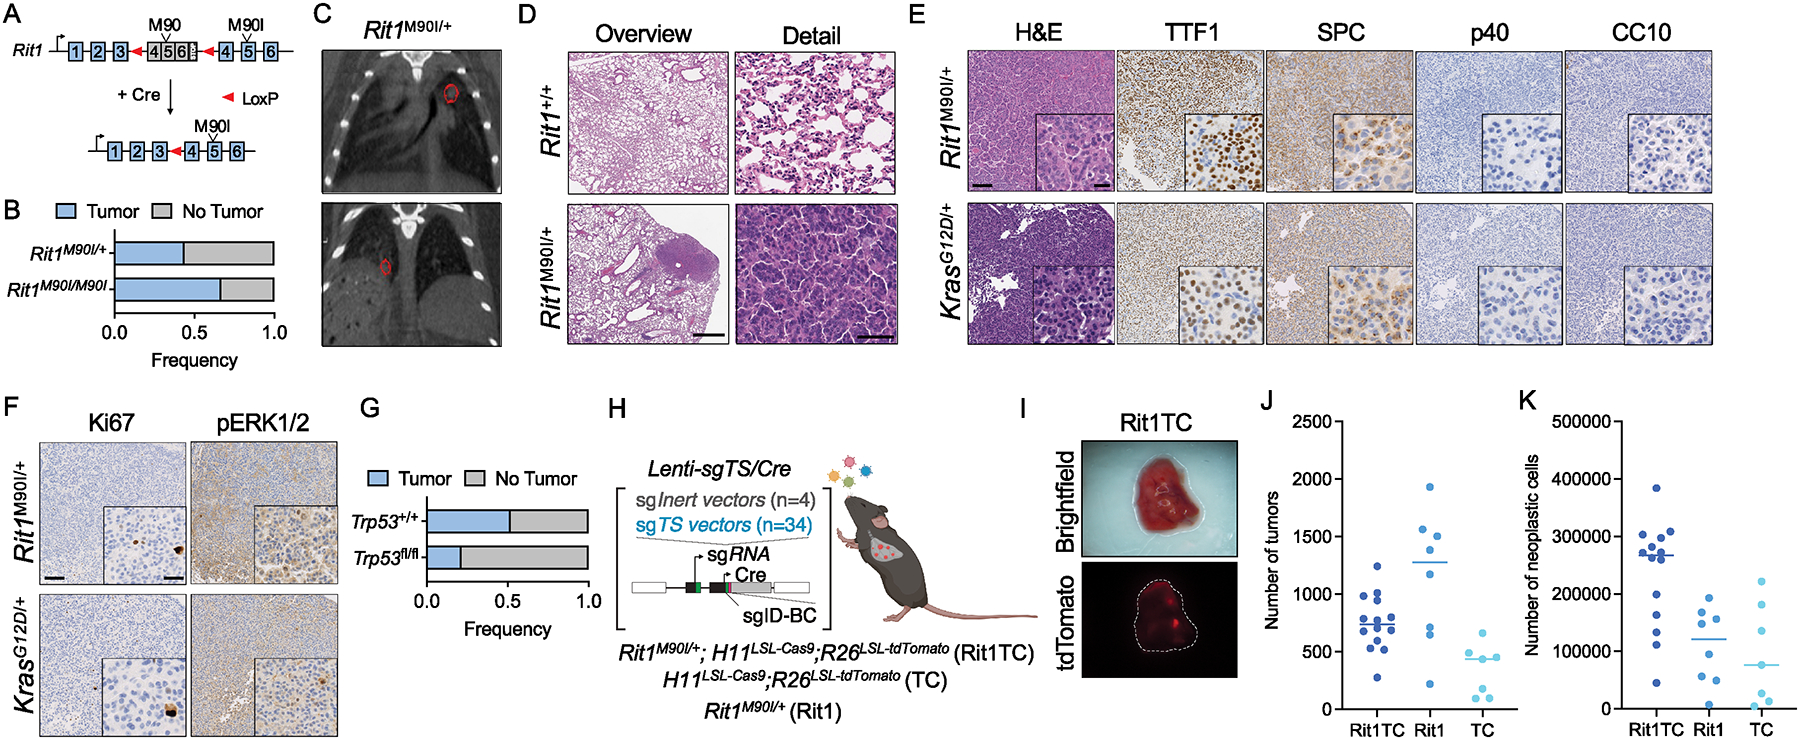
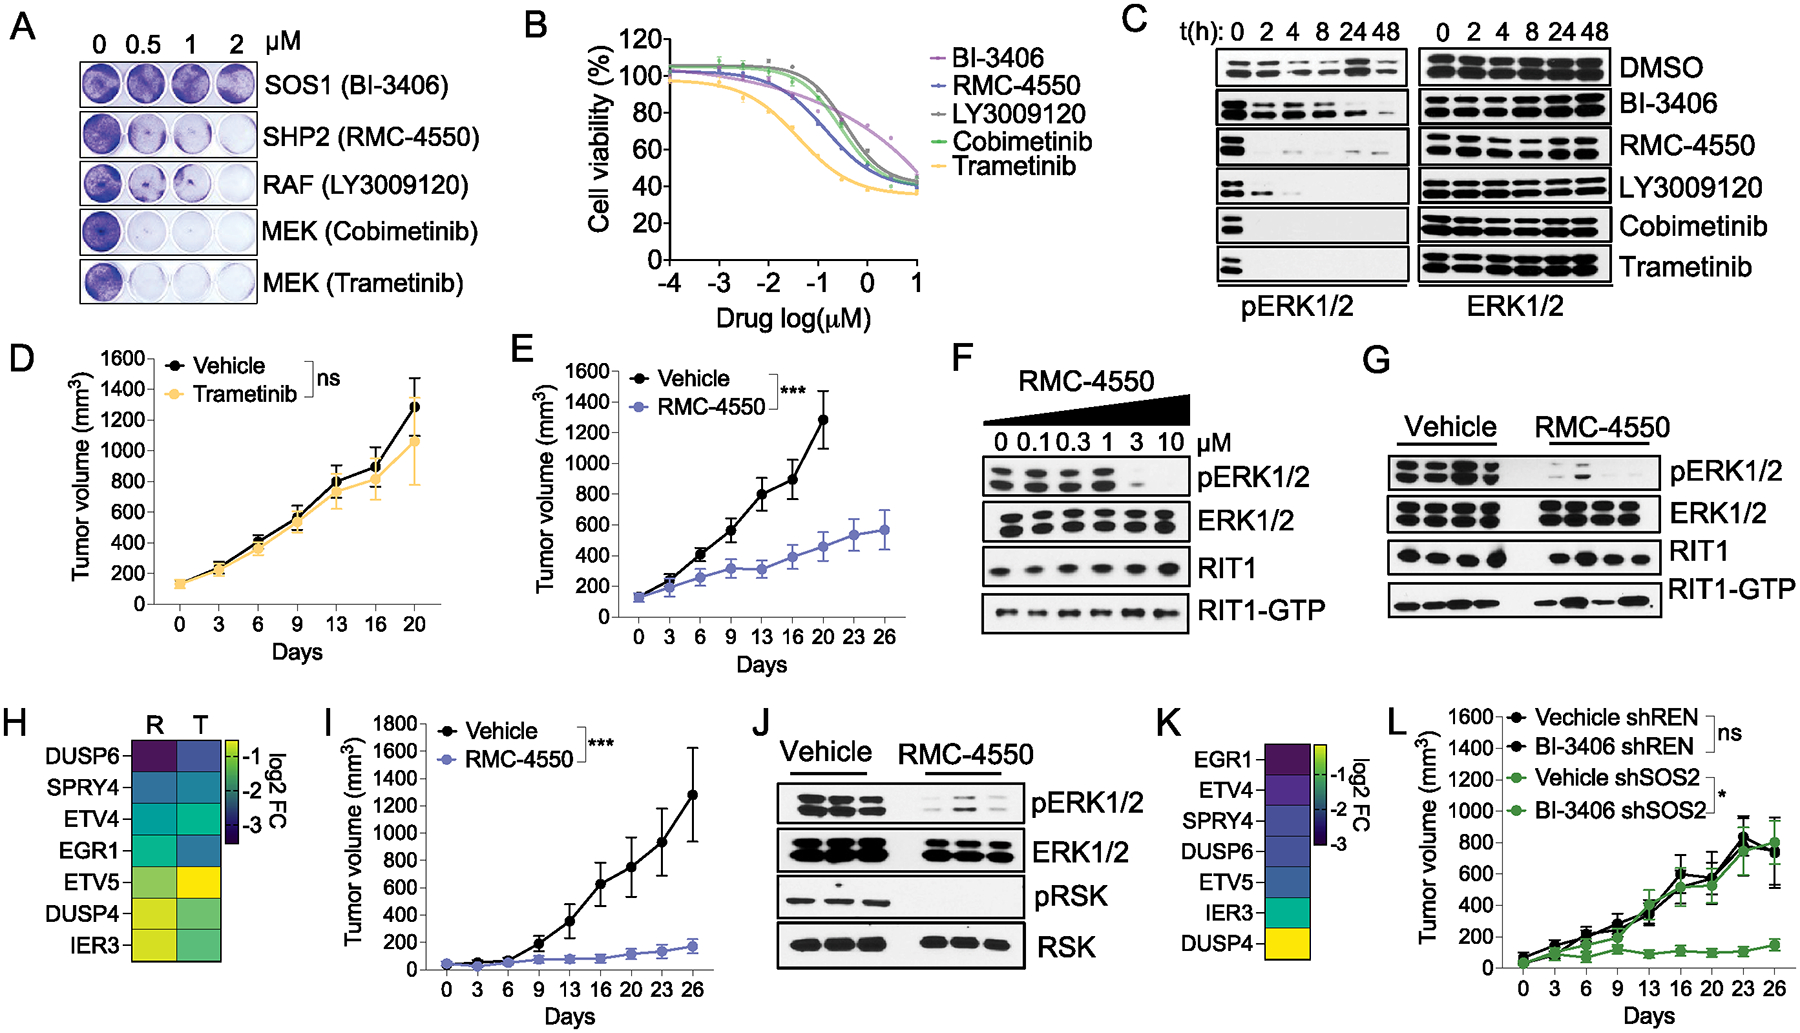
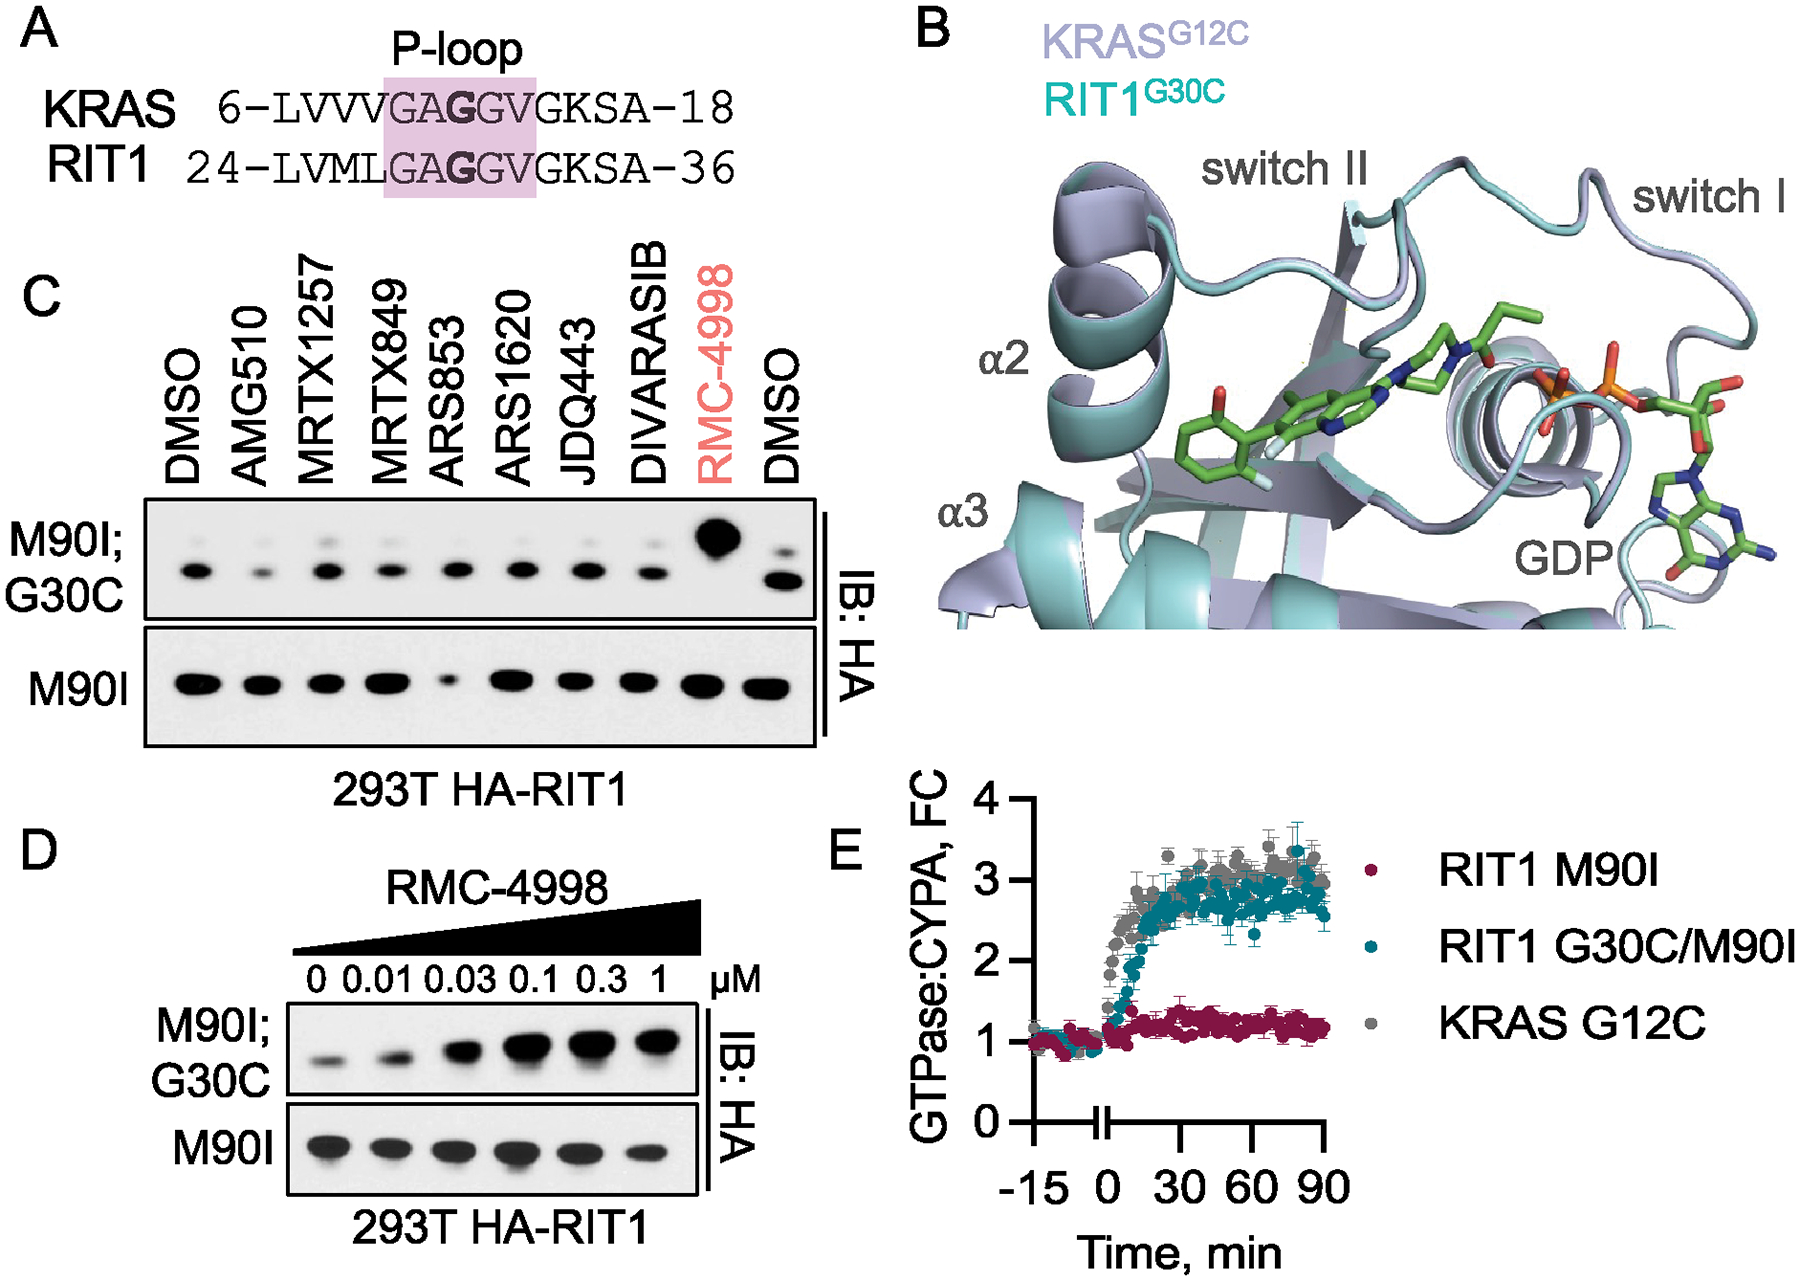
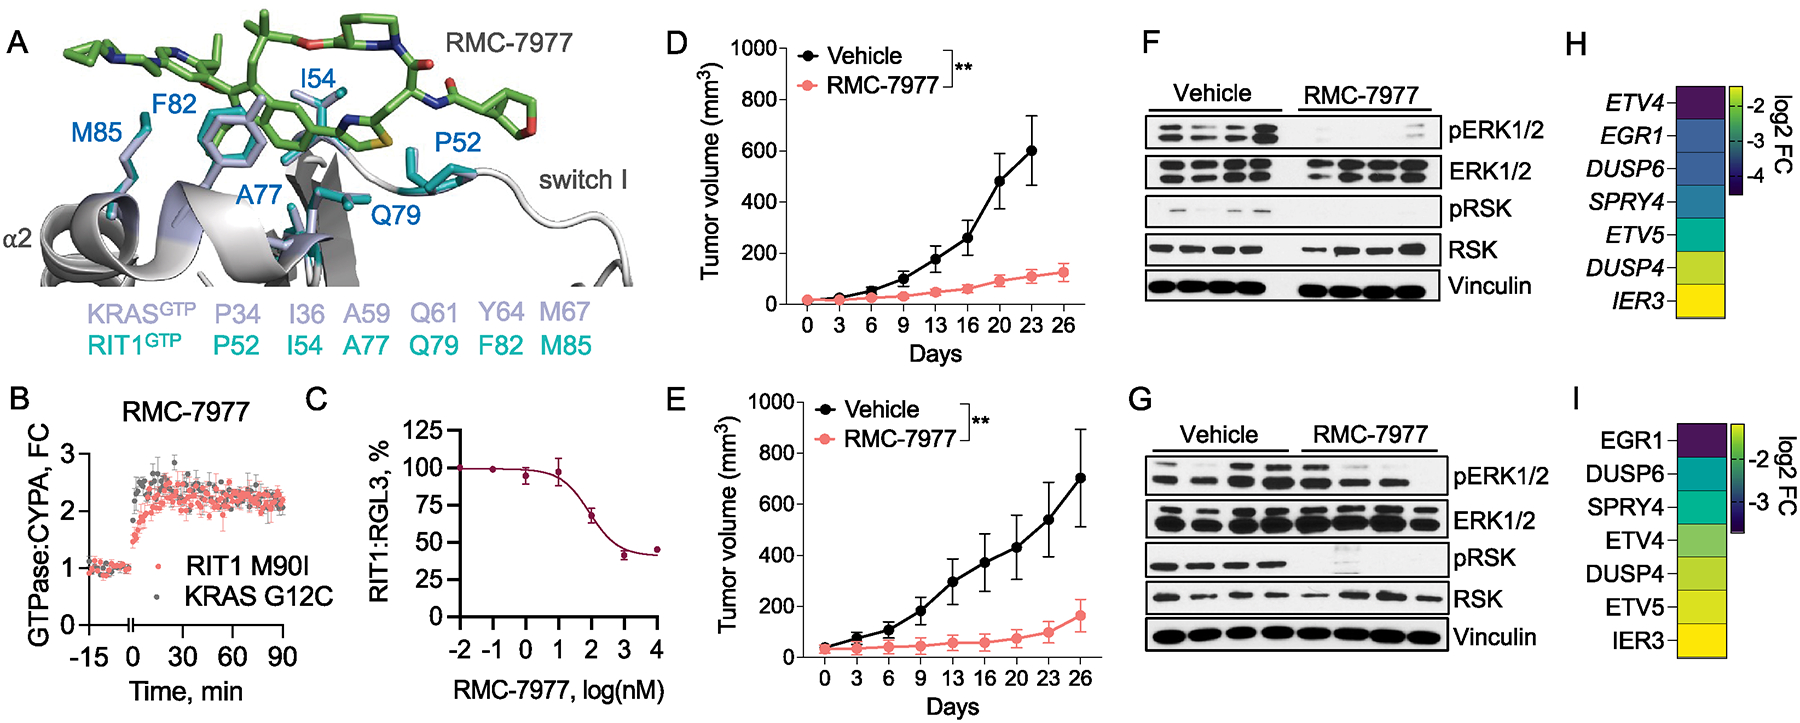
RIT1 is a small GTPase of the RAS family, and RIT1 mutations have been identified in lung cancer, leukemias, and the developmental disorder Noonan syndrome. Mutations in RIT1 lead to increased protein levels due to impaired proteolysis, resulting in dysregulation of RAS/MAPK signaling and other pathways. Here, we documented the diversity of RIT1 mutations in human lung cancer and showed that physiological expression of RIT1 M90I is sufficient to drive autochthonous lung tumor development in vivo in mouse models. Evaluation of complementary methods to either inhibit RIT1 directly or the downstream RAS/MAPK pathway revealed that RIT1 M90I tumors are sensitive to SHP2 inhibitors and RAS nucleotide exchange inhibition. Additionally, a proof-of-concept chemical biology approach identified that RAS tri-complex inhibitors bind directly to GTP-bound RIT1, resulting in tumor shrinkage. These molecules provide a feasible therapeutic approach for RIT1-driven lung tumors.


Conflict of interest statement

Conflict of interest statement:

The authors declare no potential conflicts of interest related to this work.

Figures

Figure 1.
Figure 1.. The genomic landscape of RIT1 mutant NSCLC
A. Oncoprint showing frequently altered genes in a cohort of 67 RIT1 mutant NSCLC specimens. B. Distribution of sample of origin (left) and histological diagnosis (right) in the RIT1 mutant cohort. N=67. C. Distribution of RIT1 mutations found in the clinical cohort. D. Bar plots depicting frequency of alterations in a set of selected tumor suppressors and oncogenes frequent in NSCLC. RIT1 mutated samples (n=67) are compared to the same clinical cohort of patients, excluding those with RIT1 alterations (n=10,409). E. Bar plots showing frequency of alterations in a set of selected oncogenic signaling pathways. RIT1 is removed from the RTK/RAS pathway when calculating alteration frequency. RIT1 mutated samples (n=67) are compared to the same clinical cohort of patients, excluding those with RIT1 alterations (n=10,409). A Fisher exact test and False discovery rate correction with Benjamini–Hochberg procedure was used to calculate significance. *: q-value < 0.1; **: q-value < 0.05; ***: q-value < 0.01.
Figure 2.
Figure 2.. RIT1 M90I promotes clonal expansions and oncogenic transformation in the lung
A. Schematic representation of the engineered mouse Rit1 locus that induces M90I mutation upon Cre-mediated recombination. B. Bar plot showing the frequency of tumors found by μCT imaging in a cohort of Rit1M90I/+ (n=16) and Rit1M90I/M90I (n=9) mice. C. Representative μCT imaging of two different Rit1M90I mice after 24 months of somatic recombination with adenovirus expressing Cre recombinase. Tumors are circled in red. D. Hematoxylin-eosin staining of lung sections from mice with the indicated genotypes 12 months after intranasal adenoviral Cre. No tumors were observed in control mice. Scale bars: 500 μm (Overview) and 100 μm (Detail). Using human histological diagnostic criteria, all tumors were considered G1, G2, or G3. E. Histological characterization of Rit1M90I and KrasG12D tumors using TTF1, SPC, p40, and CC10 immunohistochemistry. Scale bars: 50 μm (Overview) and 10 μm (Detail). F. Histological characterization of Rit1M90I and KrasG12D tumors using Ki67 (proliferation) and pERK1/2 (MAPK readout) immunohistochemistry 12 months after intranasal adenoviral Cre. Ki67 quantification showed <1% positivity in both models. H-score (mean±SD) for pERK staining was 77±12 for Rit1M90I and 73±10 for KrasG12D (n=6/genotype). Scale bars: 50 μm (Overview) and 10 μm (Detail). G. Bar plot showing the effect of p53 deletion on the frequency of tumors found by μCT imaging in Rit1M90I mice. Tp53+/+ (n=25) and Tp53fl/fl (n=14). H. Schematic of Tuba-seq tumor suppressor inactivation screen. Tumors were initiated in the indicated mice with a pool of barcoded lentiviral vectors (Lenti-sgTS/Cre) containing 4 inert sgRNA vectors and 34 vectors targeting known and candidate tumor suppressor genes. Created in BioRender. Castel, P. (2025) https://BioRender.com/3zxp2f1. I. Representative images of a Rit1TC lung six months after Lenti-sgTS/Cre tumor induction. J. Comparison of total number of tumors or clonal expansions greater than 25 cells in size (left panel) in Rit1TC (n=14), TC (n=7), and Rit1 (n=8) mice. K. Total number of neoplastic cells in Rit1TC (n=14), Rit1 (n=8), and TC (n=7) mice.
Figure 3.
Figure 3.. RAS nucleotide exchange inhibition is efficacious in RIT1-driven lung cancer
A. Crystal violet clonogenicity assay using H2110 cells treated with the indicated concentration of different MAPK pathway inhibitors for 7 days. B. CellTiterGlo cell viability assay using H2110 cells treated with the indicated concentration of MAPK pathways inhibitors for 72h. C. Western blot showing a time course response of H2110 exposed to 1 μM of indicated RAS pathway inhibitors. D-E. Tumor growth of H2110 xenografts treated with either 0.3 mg/kg trametinib (D) or 30 mg/kg of SHP2i RMC-4550 (E) p.o. Non significant (ns) P value (0.1605) was calculated on day 20 using a Mann-Whitney U-test. *** P value (0.0009) was calculated on day 20 using a Mann-Whitney U-test. F. Western blot of indicated proteins showing dose-dependent treatment with 0, 0.3, 1, 3, 10 μM of RMC-4550 for 2 h in H2110 cells. RIT1-GTP levels were measured using RGL3 RBD pull down. G. Western blot of indicated proteins in protein lysates from H2110 xenografts treated with vehicle or 30 mg/kg of SHP2 inhibitor RMC-4550 during 3 days (tumors were collected 2 hours after last treatment). RIT1-GTP levels were measured using RGL3 RBD pull down. H. Heat map showing log2 fold change in indicated MAPK-dependent transcripts quantified using RNA sequencing in H2110 CDX tumors treated for 3 days with RMC-4550 (R) or trametinib (T). I. Tumor growth of MSK-LX1033 PDX treated with 30 mg/kg RMC-4550 p.o. *** P value (0.0003) was calculated on day 26 using a Mann-Whitney U-test. J. Western blot of indicated proteins in protein lysates from MSK-LX1033 PDX treated with vehicle or 30 mg/kg of SHP2 inhibitor RMC-4550 during 3 days (tumors were collected 2 hours after last treatment). K. Heat map showing log2 fold change in indicated MAPK-dependent transcripts quantified using RNA sequencing in MSK-LX1033 PDX tumors treated for 3 days with RMC-4550. L. Tumor growth of H2110 xenografts expressing shRNA control (shREN) or against SOS2 (shSOS2) were treated with 50 mg/kg p.o. twice a day. To express the shRNA, mice were provided with doxycycline in the drinking water (2 mg/mL) one week before the beginning of the treatment. * P value (0.0188) was calculated on day 26 using a Mann-Whitney U-test comparing shSOS2 Vehicle vs shSOS2 BI-3406 groups.
Figure 4.
Figure 4.. RAS TCI target RIT1 due to structural mimicry
A. Protein sequence alignment between KRAS and RIT1 P-loop. KRAS G12 and RIT1 G30 are indicated in bold. B. Overview of the overlap between KRAS G12CGDP (bound to the molecule ARS-853 (grey) (PDB: 5F2E) and RIT1 G30C (cyan) (Swiss-model predicted RIT1 structure). C. HEK293T transduced with a lentiviral vector expressing HA-tagged RIT1 M90I or M90I/G30C. Cells were exposed to several KRAS G12C covalent inhibitors at 2 μM concentration for 1h. Immunoblot of the HA tag was used to assess the ability of different KRAS covalent inhibitors to produce an electrophoretic shift in the RIT1 M90I/G30C, but not RIT1 M90I. Highlighted in red is the tri-complex inhibitor RMC-4998, which was the only compound that produces a significant shift in the electrophoretic mobility of RIT1. D. HEK293T cells expressing HA-RIT1 M90I or M90I/G30C were exposed to increasing concentrations of RMC-4998. The crosslinked RMC-4998 electrophoretic shift was assessed by immunoblot of the HA tag. E. HEK293T cells transiently expressing split luciferase (SmBiT)-tagged CYPA and the indicated LgBiT-tagged RIT1 or KRAS mutants were treated with 1 μM RMC-4998 at time 0. Live cells were analyzed for drug-induced complex formation by measuring the activity of reconstituted luciferase.
Figure 5.
Figure 5.. RMC-7977 binds RIT1 and is efficacious in RIT1-driven models
A. Overview of the overlap between KRAS GTP (grey) (PDB: 8TBF) and RIT1 GTP (cyan) (swiss-model predicted RIT1 structure), showing the amino acid similarity of RIT1 and KRAS at the interaction interface with RMC-7977. Highlighted residues were previously shown to mediate interaction with RMC-7977 and are highly conserved in RIT1 (below). B. HEK293T cells transiently expressing split luciferase (SmBiT)-tagged CYPA and the indicated LgBiT-tagged RIT1 or KRAS mutants were treated with 1 μM RMC-7977 at time 0. Live cells were analyzed for drug-induced complex formation by measuring the activity of reconstituted luciferase. C. HEK293T cells transiently expressing SmBiT-RGL3 (RBD) and LgBiT-RIT1 were treated with RMC-7977 for 2h. D. Tumor growth of mouse xenografts using H2110 cells treated with 10 mg/kg of RMC-7977 p.o. **P value (0.0011) was calculated on day 23 using a Mann-Whitney U-test. E. Tumor growth of MSK-LX1033 PDX treated with 10 mg/kg of RMC-7977 p.o. **P value (0.0085) was calculated on day 26 using a Mann-Whitney U-test. F. Immunoblot analysis of indicated proteins in lysates from H2110 xenografts treated with 10 mg/kg of RMC-7977 p.o. for 3 days (tumors were collected 2 hours after last treatment). G. Immunoblot analysis of indicated proteins in lysates from MSK-LX1033 PDX xenografts treated with 10 mg/kg of RMC-7977 p.o. for 3 days. H. Heat map showing log2 fold change in indicated MAPK-dependent transcripts quantified using RNA sequencing in H2110 CDX tumors treated for 3 days with RMC-7977. I. Heat map showing log2 fold change in indicated MAPK-dependent transcripts quantified using RNA sequencing in MSK-LX1033 PDX tumors treated for 3 days with RMC-7977.

Similar articles

References

    1. Herbst RS, Morgensztern D, Boshoff C. The biology and management of non-small cell lung cancer. Nature. 2018;553:446–54. - PubMed
    1. Tan AC, Tan DSW. Targeted Therapies for Lung Cancer Patients With Oncogenic Driver Molecular Alterations. J Clin Oncol Off J Am Soc Clin Oncol. 2022;40:611–25. - PubMed
    1. Singhal A, Li BT, O’Reilly EM. Targeting KRAS in cancer. Nat Med. 2024;30:969–83. - PMC - PubMed
    1. Harada G, Yang S-R, Cocco E, Drilon A. Rare molecular subtypes of lung cancer. Nat Rev Clin Oncol. 2023;20:229–49. - PMC - PubMed
    1. Berger AH, Imielinski M, Duke F, Wala J, Kaplan N, Shi G-X, et al. Oncogenic RIT1 mutations in lung adenocarcinoma. Oncogene. 2014;33:4418–23. - PMC - PubMed

LinkOut - more resources