. 2025 Aug 11;43(8):1549-1567.e9.
doi: 10.1016/j.ccell.2025.06.015. Epub 2025 Jul 10.

TIM3+ breast cancer cells license immune evasion during micrometastasis outbreak

Affiliations

TIM3+ breast cancer cells license immune evasion during micrometastasis outbreak

Catalina Rozalén et al. Cancer Cell. .

Abstract

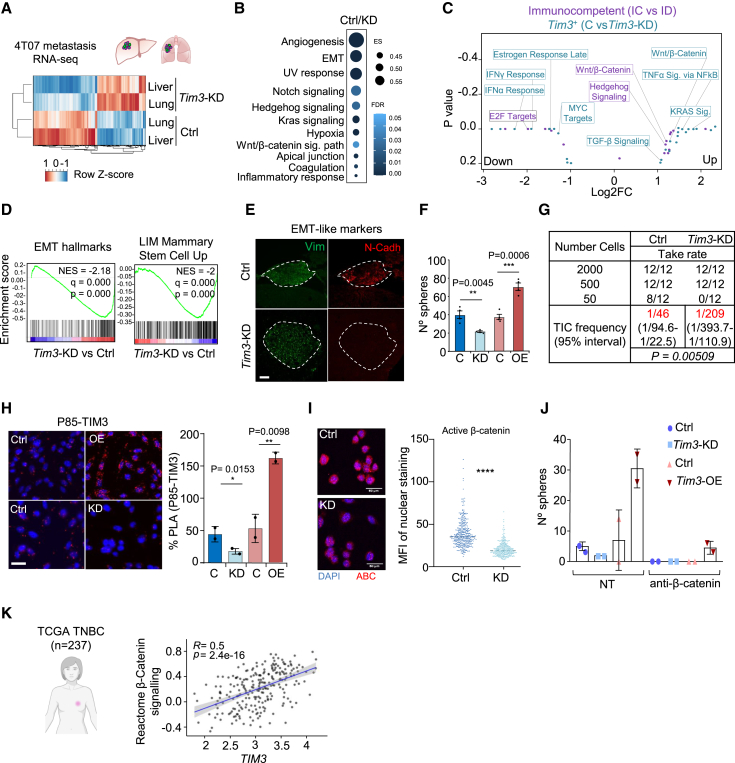
In metastasis, the dynamics of tumor-immune interactions during micrometastasis remain unclear. Identifying the vulnerabilities of micrometastases before outbreaking into macrometastases can reveal therapeutic opportunities for metastasis. Here, we report a function of T cell immunoglobulin and mucin domain 3 (TIM3) in tumor cells during micrometastasis using breast cancer (BC) metastasis mouse models. TIM3 is highly upregulated in micrometastases, promoting survival, stemness, and immune escape. TIM3+ tumor cells are specifically selected during early seeding of micrometastasis. Mechanistically, TIM3 increases β-catenin/interleukin-1β (IL-1β) signaling, leading to stemness and immune-evasion by inducing immunosuppressive γδ T cells and reducing CD8 T cells during micrometastasis. Clinical data confirm increased TIM3+ tumor cells in BC metastasis and TIM3+ tumor cells as a biomarker of poor outcome in BC patients. (Neo)adjuvant TIM3 blockade reduces the metastatic seeding and incidence in preclinical models. These findings unveil a specific mechanism of micrometastasis immune-evasion and the potential use of TIM3 blockade for subclinical metastasis.

Keywords: EMT; TIM3; TIM3 blockade; breast cancer; cancer immunoediting; immune-evasion; metastasis; micrometastasis; stemness; γδ T cells.


Conflict of interest statement

Declaration of interests L.C. receives personal fees from Roche, MSD, AstraZeneca, Diaceutics; non-financial support Roche, MSD, AstraZeneca, Phillips. F.R. has Speaker/advisory role for Roche, AstraZeneca, MSD, BMS, Novartis, GSK, Astellas, Abbvie, Menarini, Pfizer, Sophia, Agilent, Merck, Amgen, Janssen, Lilly, BioGene Funding: Roche, AstraZeneca, Menarini, Pfizer, Agilent. J.A. receives advisory/speaker fees from Roche, Pfizer, MSD, Gilead, Menarini, Bayer, Lilly, Boehringer Ingelheim, Novartis, AstraZeneca Daiichi-Sankyo; travel Gilead, AstraZeneca Daiichi-Sankyo. J.A. and T.C-T have patents on using LCOR for therapeutic purposes (not related to this study). B.B. receives fees for consulting or advisory role with Lilly, Pfizer, MSD, AstraZeneca, Menarini, Gilead. Speakers’ bureau with Roche, MSD, Daichii Sankio, AstraZeneca, Novartis, Lilly, Gilead. Travel accommodation by Pfizer, Roche and Daichii Sankio.

Figures

None
Graphical abstract
Figure 1
Figure 1
Metastasis immune pressure positively selects TIM3+ metastatic cells (A) Experimental design using immunocompetent (IC) Balb/c mice and immunodeficient (ID) NOD scid gamma (NSG) mice for the assessment of metastatic immune pressure. (B) Principal-component analysis (PCA) of the RNA-seq from EpRas cells isolated from three organ (lung, liver, and brain) metastatic samples in IC and ID hosts. (C) Unsupervised hierarchical clustering from lung, liver and brain metastasis (Z score) in ID and IC hosts (n = 3 IC and n = 3 ID independent biological replicates). (D) Gene ontology enrichment analysis of top 50 upregulated genes in all organs from IC mice. (E) GSEA of indicated gene lists with the ranked gene expression list of IC vs. ID in all organ samples. (F) Volcano plot of gene expression in all organs comparing IC and ID mice samples (n = 3 independent biological replicates). (G) Dot plot representing TIM3 expression of human breast cancer cell lines from the CCLE. Primary tumor-derived cells (gray) and metastasis-derived cells (pink). (H) Dot plot representing TIM3 protein levels measured by flow cytometry of mouse breast cancer cell lines with metastatic potential in experimental models. Color code as (G). (I) TIM3 immunofluorescence of liver tissue metastasis derived from 4T07 intracardiac injection in ID and IC mice. Representative image of TIM3 immunofluorescence. Scale bars, 100 μm. Dashed line delineates metastasis tissue. Boxplot quantification of TIM3 staining mean fluorescent intensity in from 5 independent mice (n = 5 independent biological replicates). Data represent mean ± SEM. Statistical significance; p < 0.05, ∗∗p < 0.01, and ∗∗∗p < 0.001, by unpaired Student’s t test. Also see Figure S1 and Table S1.
Figure 2
Figure 2
TIM3 drives breast cancer metastasis (A) Kaplan-Meier survival plot after intracardiac injection of 4T07 control cells versus Tim3-KD cells in ID (NSG) and IC (Balb/c) mice with the indicated conditions. Statistical analysis using Log rank (Mantel-Cox) test. (B) Relative photon flux BLI quantification of metastatic organs at day 16 after i.c. injection of 4T07 Ctrl and Tim3-KD cells. Data represents mean + SEM; dots represent independent biological replicates. (C) Relative photon flux BLI quantification of whole-body metastasis of 4T07 Ctrl and Tim3-KD in IC mice. Data represents mean + SEM. n = 22 independent biological replicates. (D) Hematoxylin-eosin staining of metastatic livers from unlabeled 4T07-Ctrl and -Tim3-KD cells. Arrows indicate metastatic lesions. (E) Quantification of micro- and macro-metastatic lesions from (D). (F) Mammary fat pad (MFP) injection of 4T1-Ctrl and -Tim3-KD cells in Balb/c mice. Data represents tumor growth by mean + SEM of n = 16 independent biological replicates. (G) Incidence of spontaneous metastasis at day 40 after primary tumor resection (day 20) of 4T1-Crtl and 4T1-Tim3-KD MFP injected mice. Individual BLI images from upper body. n = 8 Ctrl and n = 6 KD mice followed after resection. Statistical significance; p < 0.05, ∗∗p < 0.01, and ∗∗∗p < 0.001, by Chi-square test. (H) Representative immunofluorescence of breast tumor cell marker Mamaglobulin-1 (MGB1) in red and TIM3 in green in human breast cancer tissue. Scale bars, 30 μm. Representative immunohistochemistry image of TIM3 showing tumor-epithelial cell staining. Dash line delineates the tumor areas. Scale bars, 100 μm. (I) Percentage of tumor TIM3-positive samples from primary (P) and metastatic (M) matched clinical samples (ConvertHER cohort). TIM3 score percentage in primary and paired-metastatic samples (right panel). n = 75 for each condition P and M. Data represented as mean ± SEM. Statistical significance; p < 0.05, ∗∗p < 0.01, and ∗∗∗p < 0.001, by two-tailed Student’s t test in (B), (C), (E), and (I). Also see Figure S2.
Figure 3
Figure 3
TIM3+ MICs display Stemness/EMT-like features and β-catenin activation (A) Unsupervised hierarchical clustering heatmap of the indicated conditions from 4T07 metastases RNA-seq analysis (n = 2 independent biological replicates). (B) GSEA from (A) experiment comparing Ctrl and Tim3-KD (n = 2 independent biological replicates). (C) Gene ontology integration of the metastasis immunoediting RNA-seq from Figure 1A and the Tim3-KD metastasis RNA-seq (A). (D) GSEA ranked list Ctrl and Tim3-KD 4T07 tumors (lung and liver metastases) interrogated with the indicated EMT-like and stem-like gene signatures. (E) Tissue immunofluorescence representative image: for N-cadherin (red) and vimentin (green) in Ctrl and Tim3-KD metastatic livers. Dash line delineates the metastatic tissue. Scale bars, 100 μm. (F) Tumorsphere quantification at day 5 after seeding 500 4T07 cells of indicated conditions (n = 3 independent biological replicates). Data represented as mean ± SEM. (G) MFP injection and limiting dilution assay (LDA) of 4T07 Ctrl and Tim3-KD cells. Table represents serial dilution injections and tumor take rate. Tumor-initiating cell (TIC) frequency calculated by ELDA software shown in red. p value by Pearson’s Chi-squared two-tailed test. (H) Proximity ligation assay showing the interaction (red dots) of P85 and TIM3 in 4T07 Ctrl and Tim3-KD cells. Quantification of the interactions per area. Data represented as mean ± SEM. (I) Immunofluorescence of active β-catenin (ABC) in 4T07-Ctrl and Tim3-KD cells. Quantification of the nuclear staining of ABC. (J) Tumorsphere quantification of 4T07 Control, Tim3-KD, and Tim3-overexpression upon 20 μM dose of β-catenin inhibitor. (K) Rho correlation of TIM3 mRNA levels and the Reactome β-Catenin signaling signature in 237 TNBC patients TCGA. R2 and p value are shown. Statistical significance; p < 0.05, ∗∗p < 0.01, and ∗∗∗p < 0.001, by two-tailed Student’s t test in (F) and (H); unpaired Student’s t test in (I). Also see Figure S3.
Figure 4
Figure 4
TIM3 spatiotemporal dynamics in metastasis (A) Dual reporter system designed to track bulk tumor metastasis (Firefly luciferase [Fluc]-eGFP) and Tim3 promoter activity (mCherry-Nanoluciferase [Nluc]). (B) Representative BLI images of Fluc and Nluc signal in IC mice (Balb/c) upon i.c. injection of 4T07 cells experimental metastasis. BLI monitorization of metastatic growth: metastasis curve (blue line) and Tim3 reporter curve (orange line). Bar plot shows the BLI signal ratio of NLuc/FLuc representing the intensity of the Tim3 reporter signal versus the overall bulk tumor metastasis at micrometastasis and macrometastasis time points. n = 8 mice. (C) BLI ratio of NLuc/FLuc of liver metastasis. n = 8 mice. Statistical significance; p < 0.05, ∗∗p < 0.01, and ∗∗∗p < 0.001, by one-tailed Student’s t test. (D) BLI ratio curve of NLuc/FLuc metastasis along days of experiment. Each line represents individual mice. (E) Flow cytometry of 4T07-Tim3 reporter positivity measured by mCherry intensity of liver metastatic digested tissues from ID and IC at micrometastasis and macrometastasis time points. Representative plot of n = 3 individual mice per time point. (F) IF images from liver micrometastasis and macrometastasis. Luciferase (red) and TIM3 (pink) stainings. Dash line delineates the metastatic tissue. Scale bars, 100 μm. (G) Schematic representation of the lineage tracing system introduced in 4T07 cells (see STAR Methods for details). Tim3- cancer cells have red fluorescence of dsRed. Tim3+ cancer cells have green fluorescence of eGFP. (H) In vitro lineage tracing test of Tim3+ and Tim3- 4T07 cells. Induction by 4-hydroxy-tamoxifen (4-OHT) O/N at 1 μM. Flow cytometry plots represent dsRed and GFP positive events in no induced cells (top) and 4-OHT induced cells (bottom). (I) Metastasis lineage tracing using 4T07 cells after intracardiac injection in IC mice. Short TAM induction during the first 3 days of metastatic seeding (see STAR Methods). Bar plots quantifications of all lesions (113) present in livers of 6 independent experiments. Representative immunofluorescence images of liver sections showing TIM3+ (green) and TIM3- (red) metastasis in (I) and (J). (J) Long-term TAM induction during 21 days after intracardiac injection of 4T07 cells in IC and ID mice. Bar plots quantifications of all lesions (61 IC and 37 ID) present in livers of 4 independent experiments. Also see Figure S4.
Figure 5
Figure 5
TIM3+ MICs induce an immunosuppressive environment during micrometastasis (A) Single cell RNA-seq uniform manifold approximation and projection (UMAP) of CD45+ immune cells isolated from liver metastasis after 4T07 Ctrl and Tim3-KD i.c. injection. UMAP representation of: Ctrl (red) and Tim3-KD (blue) in healthy liver adjacent tissue (AT), liver micrometastasis and liver macrometastasis. (B) scRNA-seq bubble plot showing average expression (color) and percentage expression (size) of different genes defining lymphoid annotated cell compartments across metastatic conditions. Average expression legend is shared among populations. Percentage expression is relative within each immune population type. (C) Idem B for the myeloid compartment. (D) scRNA-seq cell fraction of the lymphoid cell compartment in micrometastatic samples from 4T07 Ctrl and Tim3-KD conditions. (E) Flow cytometry analysis of CD4+ T cells, CD8+ T cells and γδ T cells from liver micrometastasis from 4T07-Ctrl and 4T07-Tim3-KD. Data represents mean ± SEM, n = 11 independent biological replicates in (E), (F), and (G). (F) Flow cytometry of cytotoxic γδ T cells (GZMB+) and immunosuppressive (IL17+) γδ T cells. Dot plot represents fold change of IL-17 and GZMB γδ T cell populations in TIM3+ (Ctrl) vs. TIM3- (Tim3-KD) micrometastasis. (G) Flow cytometry of cytotoxic CD8+ T cells (GZMB+, CD69+) and exhausted T cells (PD1+) populations. Dot plot represents fold change of PD1, CD69, and GZMB positivity in TIM3+ (Ctrl) vs. TIM3- (Tim3-KD) micrometastasis. Statistical significance respect to the Ctrl; p < 0.05, ∗∗p < 0.01, and ∗∗∗p < 0.001, by unpaired Student’s t test in (E), (F), and (G). Also see Figures S5, S6, and Table S2.
Figure 6
Figure 6
Functional metastasis assessment of γδ T cells, CD8 T cells, and IL-1β in TIM3-mediated immunosuppression (A) Blocking antibody scheme; intraperitoneal administration and doses indicated. Seven days before 4T07 tumor cell i.c. injection and, weekly reminder of 250 μg of antibody during the experiment. (B) Representative BLI images of 4T07 whole body metastasis for the indicated immune blocking conditions. (C) Boxplot quantification of liver metastasis at micro (day 3) and macro (day 14) time points upon IgG2b, CD8, γδ TCR, and double (CD8, γδ TCR) cell depletion. Each dot represents independent mice. (D) Boxplot quantification of whole-body metastasis at micro (day 3) and macro (day 14) time points upon IgG2b, CD8, γδ TCR, and double (CD8, γδ TCR) cell depletion. Each dot represents independent mice. (E) In vitro proliferation and co-culture of γδ T cells with 4T07 tumor cells and flow cytometry. See STAR Methods for details. (F) Flow cytometry quantification of IL-17 γδ T cell levels after co-culture in non-treated (NT) conditions and upon anti-IL1β treatment. Data represents mean ± SEM, n = 6 (NT) and n = 4 (anti-IL1β) independent biological replicates. (G) Whole-body metastasis assays after systemic delivery of 4T07-IL-1β-KO cells compared to 4T07 TIM3+ (Ctrl) cells. Representative BLI images of metastasis at the indicated conditions. BLI metastasis growth curves. Data represents mean ± SEM, n = 10 independent mice. (H) Liver metastatic lesions at day 3 of metastatic seeding of 4T07-IL-1β-KO cells compared to 4T07 TIM3+ (Ctrl) cells. (I) Representative BLI images of ex vivo metastatic livers at day 14 after i.c. injection of 4T07-Tim3+ (Ctrl) and 4T07-IL-1β-KO cells. Statistical significance respect to the Ctrl; p < 0.05, ∗∗p < 0.01, and ∗∗∗p < 0.001, by two-tailed Student’s t test in (C), (D), (F), and (G); unpaired Student’s t test in (H). Also see Figure S7.
Figure 7
Figure 7
Clinical and preclinical evaluation of TIM3 blockade for breast cancer metastasis (A) Disease free survival (DFS) and overall survival (OS) Kaplan-Meier curves of IHC epithelial-tumor TIM3+ and TIM3- breast cancer primary tumor samples. Data obtained from Tissue microarrays (TMAs) with 257 breast cancer primary tumors from all subtypes. Statistical significance calculated by Log Rank (Mantel-Cox) for Chi-square and p value. (B) DFS Kaplan-Meier curves of IHC intratumoral tumor infiltrating lymphocytes (TILs) TIM3+ and TIM3- breast cancer primary tumor samples. TMAs with 252 breast cancer primary tumors from all subtypes. Statistical significance calculated by Log Rank (Mantel-Cox) for Chi-square and p value. (C) Violin plot of TIM3 score in patients stratified by relapse (n = 42) and non-relapse (n = 215) from breast cancer primary tumor samples. p < 0.05, ∗∗p < 0.01, and ∗∗∗p < 0.001, by two-tailed Student’s t test. (D) Multivariate Cox regression analysis of TIM3 IHC from previous samples including p value and hazard ratio (HR) with confidence interval. Factor names: TIM3 in tumor epithelial cells (eTIM3), intratumoral TILs (iTIM3), and fibroblasts (fTIM3). Estrogen-receptor positivity (ER), HER2 positivity (HER2), patient stage-II BC (pT2), patient stage-III BC (pT3), patient lymph node-1 (pN1), patient lymph node-2 (pN2), and tumor infiltrating lymphocytes (TILs). (E) Intraportal 4T07 cell injection and anti-TIM3 treatment. Representative images of liver metastasis of anti-IgG2a and anti-TIM3 conditions. Boxplots representing liver metastatic growth by BLI measurements during early time points of the experiment. Each dot represents an individual mouse. (F) Spontaneous metastasis assay using 4T1 MFP injection in Balb/c mice. At 4 × 4 mm size, anti-Tim3 treatment starts. On the left, the graph represents the primary tumor volume, and the scheme of neoadjuvant/adjuvant treatment regime of TIM3-blockade therapy (250 μg). On the right, bar plot quantification of spontaneous metastatic incidence at day 40 and take rate of metastasis incidence. Met (metastasis detection) or No-Met (no metastasis detection). n = 14 and n = 15 mice per condition. Statistical significance; p < 0.05, ∗∗p < 0.01, and ∗∗∗p < 0.001, by Chi-square test. (G) Graphical abstract of TIM3+ tumor cells from early seeding to macrometastasis in the liver. Also see Figure S8.

References

    1. Sung H., Ferlay J., Siegel R.L., Laversanne M., Soerjomataram I., Jemal A., Bray F. Global Cancer Statistics 2020: GLOBOCAN Estimates of Incidence and Mortality Worldwide for 36 Cancers in 185 Countries. CA Cancer J. Clin. 2021;71:209–249. doi: 10.3322/CAAC.21660. - DOI - PubMed
    1. Massagué J., Obenauf A.C. Metastatic colonization by circulating tumour cells. Nature. 2016;529:298–306. doi: 10.1038/NATURE17038. - DOI - PMC - PubMed
    1. Lambert A.W., Pattabiraman D.R., Weinberg R.A. Emerging Biological Principles of Metastasis. Cell. 2017;168:670–691. doi: 10.1016/J.CELL.2016.11.037. - DOI - PMC - PubMed
    1. Oskarsson T., Batlle E., Massagué J. Metastatic Stem Cells: Sources, Niches, and Vital Pathways. Cell Stem Cell. 2014;14:306–321. doi: 10.1016/J.STEM.2014.02.002. - DOI - PMC - PubMed
    1. Celià-Terrassa T., Kang Y. Distinctive properties of metastasis-initiating cells. Genes Dev. 2016;30:892–908. doi: 10.1101/gad.277681.116. - DOI - PMC - PubMed

Substances