Case Reports
. 2025 Jul 9;30(18):104037.
doi: 10.1016/j.jaccas.2025.104037.

Magnetocardiography in Diagnosis of Stress-Induced Cardiomyopathy

Affiliations
Case Reports

Magnetocardiography in Diagnosis of Stress-Induced Cardiomyopathy

Daria Hunter et al. JACC Case Rep. .

Abstract

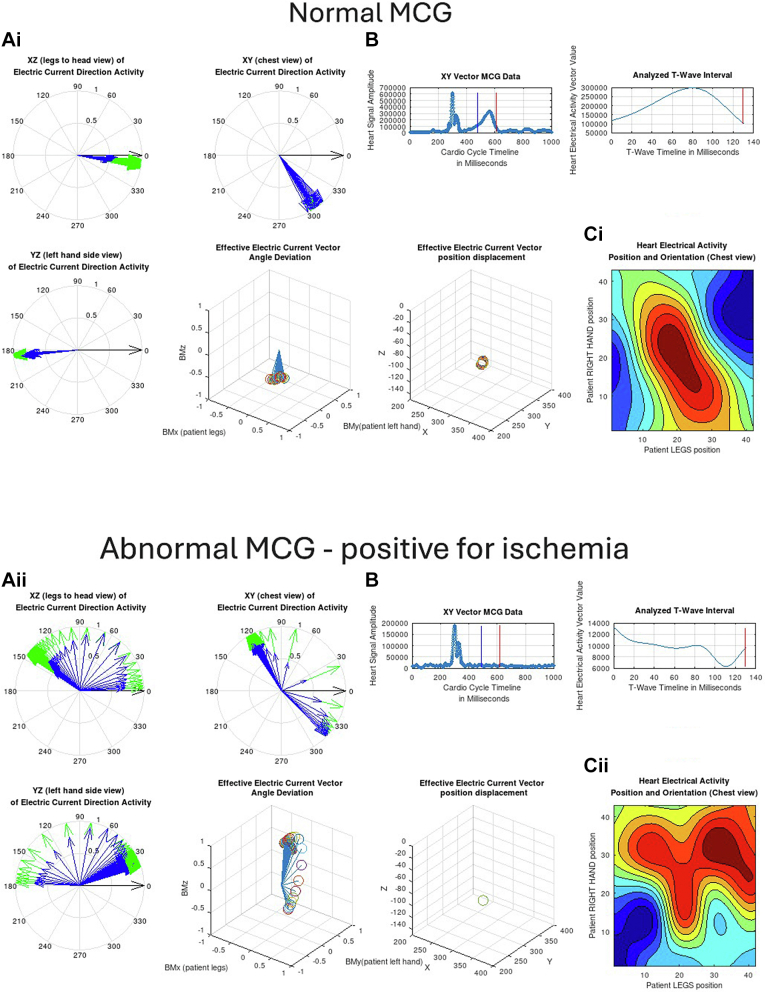
Background: Takotsubo cardiomyopathy is a difficult diagnosis to make as it frequently mimics acute coronary syndrome (ACS). Magnetocardiography (MCG) is a diagnostic modality with the potential to distinguish ischemic from nonischemic cardiac presentations.

Case summary: This case series includes 3 patients who were diagnosed with takotsubo cardiomyopathy and underwent MCG. The purpose of this study is to describe patients' and MCG's characteristics to explore the utility of MCG in the diagnosis of stress-induced cardiomyopathy and to encourage further studies in this field.

Discussion: The potential of MCG in cardiology has been explored since the 1970s, but its application in the evaluation of acute chest pain has only recently gained significant attention. To our knowledge, there are no other reports exploring the potential of MCG in the diagnosis of takotsubo cardiomyopathy.

Take-home message: If clinical and laboratory findings are concerning for ACS but MCG is consistent with no ischemia, takotsubo cardiomyopathy should be considered.

Keywords: acute coronary syndrome; cardiomypathy; chest pain.


Conflict of interest statement

Funding Support and Author Disclosures Dr Bakharev is the President of Mesuron. All other authors have reported that they have no relationships relevant to the contents of this paper to disclose.

Figures

None
Graphical abstract
Figure 1
Figure 1
Examples of Normal and Ischemic Magnetocardiography Patterns Based on MCG Result Printout Sheet Generated by Avalon-H90 MCG Magnetocardiography (MCG) printout for a patient with no ischemic heart disease (normal control), demonstrating electric current direction activity (A) acquired during T-wave (B) as well as the heart’s effective electric dipole map (C). Top panel: Healthy patient. (Ai) The MCG system captures the rotation and translation of the heart's effective electric current dipole during the T-wave in 3 planes (XZ, XY, YZ), corresponding to sagittal, coronal, and axial views, respectively. Shown is a set of uniformly oriented vectors pointing toward the lower-left quadrant in the XY and XZ planes, corresponding to a normal electric current direction activity (analogous to the normal electrocardiogram axis). The vector is narrow (nondispersed). Bottom panel: Patient with acute coronary syndrome (ACS). (Aii) Shown is a dispersed (broad) set of blue vectors and enlarged deviation in the effective electric dipole during T-wave found in a patient with ACS. (Ci) The effective electric dipole map represents the heart's electrical activity during repolarization (T-wave). Here, in a healthy participant it is uniform (oval shaped) and centrally positioned. (Cii) For comparison, the electric dipole map from a patient with ACS is multilobular, dispersed, and “off-center.”
Figure 2
Figure 2
Initial ECG in the Emergency Department Case 1 Electrocardiogram (ECG) demonstrating new diffuse upsloping ST-segment elevations.
Figure 3
Figure 3
Magnetocardiography Case 1 Initial magnetocardiography tracing was inconsistent with acute ischemic changes, including no evidence of fanning of the EECV vector (ie, the vector is narrow) and fragmentation (unstable dipole orientation) of the magnetic field map (ie, patchy, as opposed to uniform appearance). EECV = effective electric current vector.
Figure 4
Figure 4
Initial ECG in the Emergency Department Case 2 Baseline electrocardiogram (ECG) demonstrating sinus tachycardia with a known left bundle branch block pattern.
Figure 5
Figure 5
Magnetocardiography Case 2 The magnetocardiography signal was inconsistent with acute coronary syndrome; rather, it was suggestive of a benign left bundle branch block pattern, as evidenced by the vector orientation and lack of “vector fanning pattern.” In addition, there was no fragmentation of the magnetic field map. EECV = effective electric current vector.
Figure 6
Figure 6
Initial ECG in the Emergency Department Case 3 Electrocardiogram (ECG) demonstrating T-wave inversions in leads I, aVL, and V2-V6.
Figure 7
Figure 7
Magnetocardiography Case 3 Magnetocardiography demonstrating inverted electrical current throughout the T-wave, suggesting an interventricular conduction abnormality rather than ischemia. EECV = effective electric current vector.

References

    1. Cairns C, Kang K. National Hospital Ambulatory Medical Care Survey: 2021 emergency department summary tables. Accessed May 21, 2025. https://www.cdc.gov/nchs/data/nhamcs/web_tables/2021-nhamcs-ed-web-table...
    1. Prasad A., Lerman A., Rihal C.S. Apical ballooning syndrome (Tako-Tsubo or stress cardiomyopathy): a mimic of acute myocardial infarction. Am Heart J. 2008;155(3):408–417. - PubMed
    1. Park J.W., Hill P.M., Chung N., Hugenholtz P.G., Jung F. Magnetocardiography predicts coronary artery disease in patients with acute chest pain. Ann Noninvasive Electrocardiol. 2005;10(3):312–323. - PMC - PubMed
    1. Roth B.J. Biomagnetism: the first sixty years. Sensors (Basel) 2023;23(9):4218. - PMC - PubMed
    1. Brisinda D., Fenici P., Fenici R. Clinical magnetocardiography: the unshielded bet - past, present, and future. Front Cardiovasc Med. 2023;10 - PMC - PubMed

Publication types

LinkOut - more resources