. 2025 Jul 11;16(1):6444.
doi: 10.1038/s41467-025-60760-y.

Microtopography-induced changes in cell nucleus morphology enhance bone regeneration by modulating the cellular secretome

Affiliations

Microtopography-induced changes in cell nucleus morphology enhance bone regeneration by modulating the cellular secretome

Xinlong Wang et al. Nat Commun. .

Abstract

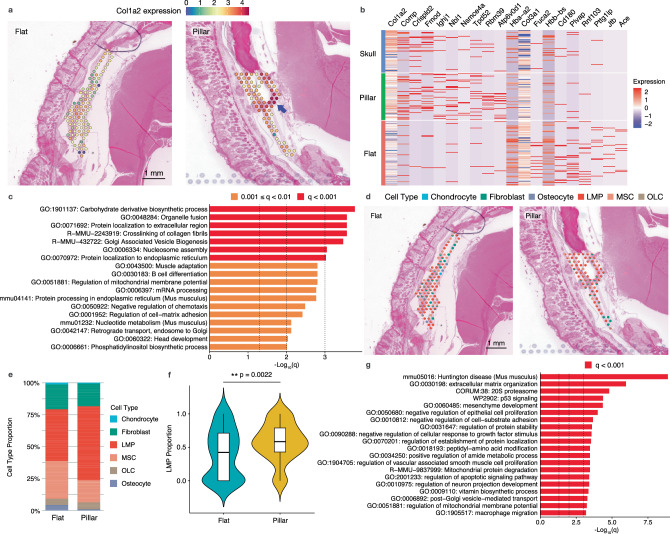
Nuclear morphology plays a critical role in regulating gene expression and cell functions. While most research has focused on the direct effects of nuclear morphology on cell fate, its impact on the cell secretome and surrounding cells remains largely unexplored. In this study, we fabricate implants with a micropillar topography using methacrylated poly(octamethylene citrate)/hydroxyapatite (mPOC/HA) composites to investigate how micropillar-induced nuclear deformation influences cell secretome for osteogenesis and cranial bone regeneration. In vitro, cells with deformed nuclei show enhanced secretion of proteins that support extracellular matrix (ECM) organization, which promotes osteogenic differentiation in neighboring mesenchymal stromal cells (MSCs). In a female mouse model with critical-size cranial defects, nuclear-deformed MSCs on micropillar mPOC/HA implants elevate Col1a2 expression, contributing to bone matrix formation, and drive cell differentiation toward osteogenic progenitor cells. These findings indicate that micropillars modulate the secretome of hMSCs, thereby influencing the fate of surrounding cells through matricrine effects.


Conflict of interest statement

Competing interests: An Invention Disclosure has been filed for the mPOC micropillar scaffold through Northwestern University (X.W., V.A., V.B., and G.A.A.). G.A.A. is the inventor of US Food and Drug Administration-approved citrate-based biomaterials. The remaining authors declare no competing interests.

Figures

Fig. 1
Fig. 1. Fabrication of surface-engineered mPOC/HA implants.
a Illustration shows the combination of UV lithography and contact printing to fabricate free-standing mPOC/HA micropillars. b SEM image shows the micropillar structures made of mPOC/HA. c Optical microscope image and d cross-section analysis of mPOC/HA micropillars. e Surface scanning of flat and micropillar implants by AFM. f Surface roughness of flat and micropillar implants. N.S., no significant difference, n = 3 biological replicates. g Degradation test and h calcium release of flat and micropillar mPOC/HA implants. N.S., no significant difference, n = 4 biological replicates, insert plot shows the initial release of calcium within 24 h. i. Representative images of flat and micropillar implants at different time points after accelerated degradation. Data are presented as mean ± SD. Values from two groups were compared using a non-paired Student’s t-test (two-sided). Source data is provided as a Source Data file.
Fig. 2
Fig. 2. Nuclear deformation promotes osteogenic differentiation of hMSCs.
a Staining of nucleus (green) and F-actin (red) of hMSCs on flat and micropillar mPOC/HA surfaces. Insert: high magnification of cell nucleus. Dashed lines indicate micropillars. b Analysis of nuclear shape index of hMSCs. n = 117 (flat) and 132 (pillar) collected from 3 biological replicates, ****p < 0.0001. c Orthogonal view of cell nucleus on flat and micropillar surfaces. d Nuclear volume analysis based on 3D construction of the confocal images of cell nuclei. n = 35 cells collected from 3 biological replicates, ****p < 0.0001. e Initial cell adhesions on flat and micropillar surfaces. n = 5 biological replicates, N.S., no significant difference. f SEM images show the cell adhesions on flat and micropillar mPOC/HA surfaces. g Live/dead staining of hMSCs on flat and micropillar surfaces at 72 h in osteogenic medium. h Cell metabolic activity of cells on flat and micropillar surfaces tested by a MTT assay. n = 5 biological replicates, ****p < 0.0001. i Cell proliferation tested via DNA content after 72 h induction. n = 5 biological replicates, N.S., no significant difference. j ALP staining of hMSCs on flat and micropillar surfaces after 7 d induction. k ALP activity test of cells after 7 d osteogenic induction. n = 3 biological replicates. l Blot images of osteogenic marker OCN and RUNX2 in cells cultured on flat and micropillar implants. GAPDH is shown as a control. Quantification (m) OCN and (n). RUNX2 according to Western blot tests. n = 3 biological replicates, ****p < 0.0001. Data are presented as mean ± SD. Values from two groups were compared using a non-paired Student’s t-test (two-sided). Source data are provided as a Source Data file.
Fig. 3
Fig. 3. Secretome of hMSCs on flat and micropillar mPOC/HA surfaces.
a PCA plot of differentially expressed proteins secreted by hMSCs on flat and micropillars. Cyan: flat; Red: micropillar. b Volcano plot of proteins secreted by hMSCs seeded on micropillars compared to the flat surface. Blue and orange dots indicate significantly downregulated and upregulated proteins secreted by cells on micropillars compared to those on flat surface. Grey dots indicate non-significantly changed proteins. A threshold of expression greater than 2 times fold-change with p < 0.05 was considered to be significant (non-paired Student’s t-test (two-sided)). Proteins that are related with collagen-ECM pathways are labeled. c Top 4 significantly enriched GO terms and Pathways identified through over-representation analysis using the one-sided Fisher’s exact test. Significance was determined based on adjusted p-values < 0.05 (FDR < 5%, Benjamini-Hochberg). ***p < 0.001. d The most significantly enriched Biological Processes (one-sided Fisher’s exact test, adjusted p-values < 0.05 (FDR < 5%, Benjamini-Hochberg)). e Heatmap of proteins that are related to collagen-containing extracellular matrix and ossification. F indicates flat samples and P indicates pillar samples, n = 3 biological replicates for each group. f The linkages of proteins and GO terms in biological processes related to collagen fibers, ECM, and ossification as a network. g Heatmap of the top 15 enriched terms plotted based on Reactome pathway analysis. Source data are provided as a Source Data file.
Fig. 4
Fig. 4. The paracrine effect of cells with/without nuclear deformation tested through transwell assay.
a Schematic illustration of the experiment setup. b ALP staining and (c). quantification of ALP-positive cells on transwell membrane incubated with undeformed and deformed MSCs (n = 3 biological replicates). d ARS staining and e. quantification of cells on transwell membrane incubated with undeformed and deformed MSCs (n = 6 biological replicates). (f) Immunofluorescence staining images of collagen in the ECM of cells on the transwell membrane incubated with undeformed and deformed MSCs. g The coverage of collagen was analyzed according to the staining images (n = 4 biological replicates). h EDS images showing Ca, P, and SEM images of cells on the transwell membrane incubated with undeformed and deformed MSCs. Data are presented as mean ± SD. Values from two groups were compared using a non-paired Student’s t-test (two-sided). Source data is provided as a Source Data file.
Fig. 5
Fig. 5. mPOC/HA micropillar implant promotes bone regeneration in vivo.
a Image shows implantation of hMSC seeded flat and micropillar mPOC/HA scaffolds. b Staining images of nuclei (green) and F-actin (red) of cells on the implants. c Representative μCT images of a typical animal implanted with hMSC-seeded flat (left) and micropillar (right) scaffolds at 12-weeks post-surgery. d Regenerated bone volume in the defect region (n  =  5 animals). e Trichrome staining of the defect tissue treated with flat and micropillar implants. f Average thickness of regenerated tissues with implantation of flat and micropillar scaffolds (n  =  5 animals). IHC staining of osteogenic marker, g OPN and h. OCN, in regenerated tissues with flat and micropillar implants. Data are presented as mean ± SD. Values from two groups were compared using non-paired Student’s t-test (two-sided). Source data is provided as a Source Data file.
Fig. 6
Fig. 6. Spatial transcriptomic analysis of tissues regenerated with flat and micropillar implants.
a Spatial plot of Col1a2 expression profile in tissues regenerated with flat mPOC/HA implant and micropillar mPOC/HA implant. Arrow indicates enhanced expression around dura layer. b The heatmap showing the top ten up- and down-regulated DEGs (pillar vs flat) in tissues regenerated with flat mPOC/HA implant, micropillar mPOC/HA implant, and native skull tissue. c Gene Ontology analysis results based on the top 100 up-regulated genes (pillar vs flat). The results are colored by q, false-discovery-rate-adjusted p-value. d Deconvoluted cell types in each spatial capture location in flat and micropillar groups. Each pie chart shows the deconvoluted cell type proportions of the capture location. e Bar plots of the cell type proportions in tissues regenerated with flat mPOC/HA implant and micropillar mPOC/HA implant. LMPs, MSCs, and fibroblasts are the predominant cell types. f Violin plot of the proportion of LMPs in flat (100 capture locations) and micropillar (69 capture locations) groups. The boxplots display medians and quartiles, with whiskers extending to 1.5 times the interquartile range, and the violin plot outlines represent the kernel probability density. The p-value from a two-sided Wilcoxon rank-sum test is shown. g Top enriched processes associated with LMP compared with other cell lineages. LMP: late mesenchymal progenitor cells; MSC: mesenchymal stromal cells; OLC: MSC-descendant osteolineage cells. The results are colored by q, false-discovery-rate-adjusted p-value. Source data are provided as a Source Data file.

Update of

References

    1. Rippe, K. Dynamic organization of the cell nucleus. Curr. Opin. Genet. Dev.17, 373–380 (2007). - PubMed
    1. Kalukula, Y., Stephens, A. D., Lammerding, J. & Gabriele, S. Mechanics and functional consequences of nuclear deformations. Nat. Rev. Mol. Cell Biol.23, 583–602 (2022). - PMC - PubMed
    1. Ramdas, N. M. & Shivashankar, G. V. Cytoskeletal control of nuclear morphology and chromatin organization. J. Mol. Biol.427, 695–706 (2015). - PubMed
    1. Heckenbach, I. et al. Nuclear morphology is a deep learning biomarker of cellular senescence. Nat. Aging2, 742–755 (2022). - PMC - PubMed
    1. Seelbinder, B. et al. Nuclear deformation guides chromatin reorganization in cardiac development and disease. Nat. Biomed. Eng.5, 1500–1516 (2021). - PMC - PubMed

LinkOut - more resources