. 2025 Jul 11;16(1):6422.
doi: 10.1038/s41467-025-61544-0.

Gut microbiota and brain-resident CD4+ T cells shape behavioral outcomes in autism spectrum disorder

Affiliations

Gut microbiota and brain-resident CD4+ T cells shape behavioral outcomes in autism spectrum disorder

John Chulhoon Park et al. Nat Commun. .

Abstract

Autism spectrum disorder (ASD) is a neurodevelopmental disorder characterized by alterations in social, repetitive, and anxiety-like behaviors. While emerging evidence suggest a gut-brain etiology in ASD, the underlying mechanisms remain unclear. To dissect this axis, we developed a germ-free BTBR mouse model for ASD. The absence of gut microbiota in male mice ameliorates ASD-associated behaviors and reduces populations of inflammatory brain-resident T cells. Additionally, CD4+ T cell depletion mitigates neuroinflammation and ASD behaviors, suggesting a gut-immune-brain axis. We identify several microbial and metabolic regulators of ASD, particularly those relevant to the glutamate/GABA ratio and 3-hydroxyglutaric acid. Using an in silico metabolite prediction model, we propose Limosilactobacillus reuteri IMB015 (IMB015) to be a probiotic candidate. Administration of IMB015 reduces the glutamate/GABA ratio and neuroinflammation, resulting in improved behaviors. Here we report a gut-immune-brain axis in which the gut microbiota and its metabolites can modulate brain-resident immune cells and ASD-associated behaviors.


Conflict of interest statement

Competing interests: J.L., S.L., and S.Y.C. are employees of ImmunoBiome. S.-H.I. is the founder and major shareholder of ImmunoBiome. The other authors declare no competing interests.

Figures

Fig. 1
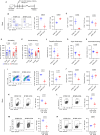
Fig. 1. GF BTBR do not manifest ASD-associated phenotypes.
A Representative heat maps and time spent in either the social or empty chambers during the three-chamber sociability test. SPF BTBR n = 18, GF BTBR n = 22. P value from two-way ANOVA, F1,76 = 1.948. B Representative heat maps and time spent in either the familiar or novel chambers during the three-chamber social novelty test. SPF BTBR n = 18, GF BTBR n = 22. P value from two-way ANOVA, F1,76 = 5.817. C Representative images and percent of marbles buried during the marble burying test. SPF BTBR n = 12, GF BTBR n = 18. P = 0.000002 from two-tailed Welch’s t-test, t(11.97) = 6.540. D Representative traces, time spent in the center zone, and frequency to the center zone during the open field maze. SPF BTBR n = 10, GF BTBR n = 12. P value from two-tailed Welch’s t-test, t(12.76) = 3.785 and t(18.95) = 0.7207, respectively. E Mean velocity and distance traveled during the open field maze. SPF BTBR n = 10, GF BTBR n = 12. P value from two-tailed Welch’s t-test, t(18.95) = 0.7207 and t(18.94) = 0.7229. FH Representative immunofluorescence staining and number of c-FOS+ neurons per area in the amygdala (two-tailed Student’s t-test, t(5) = 3.562. SPF BTBR n = 5 sections, 3 mice, GF BTBR n = 7 sections, 4 mice) (G) and dentate gyrus of the hippocampus (t(10) = 3.769. SPF BTBR n = 6 sections, 3 mice, GF BTBR n = 6 sections, 3 mice) (H). All data represented as mean ± SEM. Source data are provided as source data file.
Fig. 2
Fig. 2. Microbiota regulates brain-resident T cells in BTBR mice.
A Representative flow cytometry plots and frequency of CD4+ or CD8+ T cells gated from TCRβ+ CD45+ live cells within the whole brain parenchyma of SPF or GF BTBR mice. SPF BTBR n = 5 mice, GF BTBR n = 4 mice. P values from two-tailed Student’s t-test, t(7) = 4.385 and t(7) = 2.958, respectively. B Representative flow cytometry plots and frequency of Foxp3+ Tregs gated from CD4+ T cells in the brain. SPF BTBR n = 5 mice, GF BTBR n = 4 mice. P value from two-tailed Student’s t-test, t(7) = 6.887. C, D Representative flow cytometry plots and frequency of IFN-γ+ Foxp3- CD4+ T cells or IFN-γ+ CD8+ T cells in the brain parenchyma. SPF BTBR n = 5 mice, GF BTBR n = 4 mice. P values from two-tailed Student’s t-test, t(7) = 7.625 and t(7) = 4.912, respectively. E Representative flow cytometry plots and frequency of CD69+ T cells in the brain gated from TCRβ+ CD45+ cells. SPF BTBR n = 5 mice, GF BTBR n = 4 mice. P values from two-tailed Student’s t-test, t(7) = 3.028. F Representative flow cytometry plots and frequency of Ki67+ T cells in the brain gated from CD45+ cells. SPF and GF BTBR n = 8 mice, P value from two-tailed Student’s t-test, t(14) = 3.185. Flow cytometric analyses are representative results from at least 2 independent experiments with minimum of 4 mice. All data represented as mean ± SEM. Source data are available in source data file.
Fig. 3
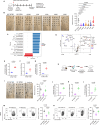
Fig. 3. Depletion of CD4+ T cells abrogate ASD-associated behaviors and neuroinflammation.
A SPF BTBR pups were injected with 25 μg/g of anti-CD4 by i.p. on P5, P13, and P36. Mice were analyzed at 8 weeks of age. B, C BTBR αCD4 mice had reduced frequency (B) and cell number (C) of brain-resident CD4+ T cells. CD8+ T cell frequency was increased (B), but not its absolute number (C). BTBR Ctrl n = 3 mice, BTBR αCD4 n = 5 mice. P value from two-tailed Student’s t-test, t(6) = 5.437 and t(6) = 4.701 (B) and t(6) = 4.719 and t(6) = 0.9473 (C). D, E Time spent in chambers during the three-chamber sociability (D) and social novelty (E) tests. BTBR αCD4 sociability P = 0.00009, P value from two-way ANOVA, F1,40 = 2.590 and F1,40 = 12.42, respectively. BTBR Ctrl n = 9, BTBR αCD4 n = 13. F Percent of marbles buried during the marble burying test. P value from two-tailed Welch’s t-test, t(28.30) = 3.929. BTBR Ctrl n = 16, BTBR αCD4 n = 15. G, H Time spent in the center zone (G) and mean velocity (H) during the open field maze. BTBR Ctrl n = 14, BTBR αCD4 n = 13. P value from two-tailed Welch’s t-test, t(23.52) = 3.077 and t(24.98) = 2.402, respectively. I, J Representative flow cytometry plots, frequencies (I) and absolute cell numbers (J) of microglia and macrophages from live cells of the brain parenchyma. BTBR Ctrl n = 3 mice, BTBR αCD4 n = 5 mice. P values from two-tailed Student’s t-test, t(6) = 6.006 and t(6) = 1.733 (I) and t(6) = 3.458 and t(6) = 0.6370 (J). K–N Representative flow cytometry plots and frequencies of IL-10+ (K), IL-6+ (L), TNF-α+ (M), and IL-1β+ (N) microglia. BTBR Ctrl n = 3 mice, BTBR αCD4 n = 5 mice. P values from two-tailed Student’s t-test, t(6) = 2.752 (K), t(6) = 4.726 (L), t(6) = 3.538 (M), t(6) = 0.5021 (N). Flow cytometric analyses are representative results from at least 2 independent experiments with minimum of 3 mice. All data represented as mean ± SEM. Source data are available in source data file.
Fig. 4
Fig. 4. Identification of gut microbiota and metabolites that drive ASD in BTBR mice.
A Schematic for antibiotic treatment. B Representative images and percent of marbles buried. SPF and GF BTBR n = 5, AVNM n = 9, AVN n = 22, ANM n = 25, AVM n = 17 VNM n = 20. SPF BTBR vs AVN P = 0.00008, P values from one-way ANOVA with Bonferroni’s correction, F6,96 = 10.42. C Linear discriminant analysis Effect Size (LEfSe) for genera enriched in AVNM or VNM groups. Genera with FDR-adjusted P value cutoff of 0.01 and Log LDA > 2.0 shown. D Volcano plot of fecal metabolites enriched in AVNM or VNM mice. Fold change threshold of 2.0 with two-tailed raw P value threshold of 0.05 from unpaired analysis with equal group variances. Significant metabolites labeled. EG Relative glutamate (E), glutamate to GABA ratio (F), and 3-hydroxyglutaric acid (OH-GlutAcid) (G) levels in the feces normalized to AVNM. n = 6 mice. P = 0.000002 (E) and P = 0.000008 (G). P values from two-tailed Student’s t-test, t(10) = 9.627 (E), t(10) = 3.611 (F), t(10) = 8.325 (G). H Schematic of L. murinus isolation and monoassociation. I Representative images and percent of marbles buried. SPF BTBR n = 9, GF BTBR n = 18, GF BTBR + L. murinus n = 10. SPF BTBR vs GF BTBR P = 0.00003. P values from one-way ANOVA with Bonferroni’s correction, F2,34 = 15.97. JL Relative glutamate (J), glutamate to GABA ratio (K), and 3-hydroxyglutaric acid (L) levels in feces after L. murinus monoassociation. GF BTBR n = 6 mice, L. murinus n = 5 mice. P = 0.00000005 (J), P = 0.00008 (K). P values from two-tailed Student’s t-test, t(9) = 16.37 (J), t(9) = 6.768 (K), t(9) = 2.924 (L). M, N Representative flow cytometry plots and frequencies of IFN-γ+ Foxp3- CD4+ (M) and IFN-γ+ CD8+ (N) T cells in the brain after L. murinus monoassociation. SPF and GF BTBR n = 4 mice, L. murinus n = 5 mice. P values from one-way ANOVA with Bonferroni’s correction, F2,10 = 11.02 (M), F2,10 = 5.215 (N). All data represented as mean ± SEM. Source data are available in source data file.
Fig. 5
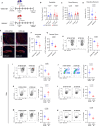
Fig. 5. Healthy B6 microbiota confers neurotypical behavior and neuroimmune modulation in BTBR mice.
A 3-weeks-old GF BTBR pups were cohoused with either SPF B6 (BTBR-B6) or SPF BTBR (BTBR-BTBR) mice. B, C Duration in chambers during the sociability (B) and social novelty (C) tests. BTBR-BTBR n = 14, BTBR-B6 n = 24, P values from two-way ANOVA, F1,72 = 8.186 (B), F1,72 = 10.61 (C). D Percent of marbles buried. BTBR-BTBR n = 24, BTBR-B6 n = 22, P value from two-tailed Welch’s t-test, t(40.98) = 3.213. E–G Representative immunofluorescence staining and number of c-FOS+ neurons per area in the amygdala (F) and dentate gyrus (G). P value from two-tailed Student’s t-test, t(26) = 4.445, BTBR-BTBR n = 15 sections, 5 mice, BTBR-B6 n = 13 sections, 5 mice (F). t(22) = 4.180, BTBR-BTBR n = 12 sections, 5 mice, BTBR-B6 n = 12 sections, 5 mice (G). H, I Representative flow cytometry plots and frequencies of IFN-γ+ Foxp3- CD4+ (H) or IFN-γ+ CD8+ (I) T cells in the brain. BTBR-BTBR and BTBR-B6 n = 4 mice, P value from two-tailed Student’s t-test, t(6) = 2.711 (H), t(6) = 2.507 (I). J Representative flow cytometry plots and frequencies of CD11b+ CD45int microglia in the brain. BTBR-BTBR and BTBR-B6 n = 5 mice, P values from two-tailed Student’s t-test, t(8) = 2.404. KN Representative flow cytometry plots and frequencies of IL-10+ (K), IL-6+ (L), TNF-α+ (M), or IL-1β+ (N) microglia in the brain. BTBR-BTBR n = 6 mice, BTBR-B6 n = 5 mice. P values from two-tailed Student’s t-test, t(9) = 2.289 (K), t(9) = 2.988 (L), t(9) = 1.982 (M), t(9) = 3.125 (N). Flow cytometry data are representative of at least 2 independent experiments with minimum 3 mice. All data represented as mean ± SEM. Source data are available in source data file.
Fig. 6
Fig. 6. Healthy gut microbiota reduces ASD-associated metabolites in BTBR mice.
A Beta diversity from Principal coordinates analysis (PCoA) based on Bray-Curtis dissimilarity index demonstrating a unique microbiota composition following colonization with healthy gut microbiota from B6 mice (Pairwise PERMANOVA, F = 5.61, R2 = 0.38, P = 0.004). B LEfSe analysis of genera enriched in SPF BTBR or B6 microbiota recipient BTBR (BTBR-B6) mice. Genera with FDR-adjusted P value cutoff of 0.1 and Log LDA > 2.0 shown. C Volcano plot of fecal metabolites enriched in SPF BTBR or BTBR-B6 mice. Fold change threshold of 1.5 with two-tailed raw P value threshold of 0.05 from unpaired analysis with equal group variances. All significant metabolites labeled. DF Relative glutamate (D), glutamate to GABA ratio (E), and 3-hydroxyglutaric acid (F) levels in feces after colonization with healthy gut microbiota. SPF BTBR n = 5, BTBR-B6 n = 6. P values from two-tailed Student’s t-test, t(9) = 2.299 (D), t(9) = 2.000 (E), t(9) = 2.466 (F). All data represented as mean ± SEM. Source data are available in source data file.
Fig. 7
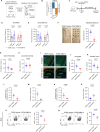
Fig. 7. L. reuteri IMB015 therapeutically alleviates ASD-associated phenotypes.
A Schematic diagram of in silico metabolic flux prediction. B Predicted GABA and L-glutamate production or uptake in IMB015. C Schematic diagram of IMB015 treatment. D, E Time spent in chambers during the sociability (D) and social novelty (E) tests. BTBR Vehicle n = 24, BTBR IMB015 n = 20, P values from two-way ANOVA, F1,84 = 0.096673 (D), F1,84 = 21.67 (E). F Representative images and percentage of marbles buried. BTBR Vehicle n = 21, BTBR IMB015 n = 13. P = 0.000000005. P value from two-tailed Welch’s t-test, t(22.62) = 9.059. G, H Time spent in the center zone (G) and mean velocity (H) during the open field maze. BTBR Vehicle n = 14, BTBR IMB015 n = 19. P value from two-tailed Welch’s t-test, t(15.43) = 2.494 (G), t(28.60) = 0.190 (H). IK Representative immunofluorescence staining and number of c-FOS+ neurons per area in the amygdala (two-tailed Student’s t-test, t(16) = 3.593. BTBR Vehicle n = 10 sections, 3 mice, BTBR IMB015 n = 8 sections, 4 mice) and dentate gyrus (t(29) = 3.504. BTBR Vehicle n = 16 sections, 3 mice, BTBR IMB015 n = 15 sections, 3 mice). LN Relative glutamate (L), glutamate/GABA ratio (M), and Oh-GlutAcid (N) levels in feces after IMB015 treatment. BTBR Vehicle n = 8, BTBR IMB015 n = 5. P values from two-tailed Student’s t-test, t(11) = 2.382 (L), t(11) = 3.252 (M), t(11) = 2.108 (N). O Absolute cell count of Tregs in the brain from flow cytometry. BTBR Vehicle n = 14, BTBR IMB015 n = 7. P value from two-tailed Student’s t-test, t(19) = 2.891. P, Q Representative flow cytometry plots and frequencies of IFN-γ+ Foxp3- CD4+ (P) or IFN-γ+ CD8+ (Q) T cells in the brain. BTBR Vehicle n = 5 mice, BTBR IMB015 n = 4 mice. P value from two-tailed Student’s t-test, t(7) = 3.741 (P), t(7) = 3.010 (Q). Flow cytometry data from 2 independent experiments with minimum 3 mice. Data represented as mean ± SEM. Source data are available in source data file.

References

    1. Park, J. C. & Im, S. H. The gut-immune-brain axis in neurodevelopment and neurological disorders. Microbiome Res. Rep.1, 23 (2022). - PMC - PubMed
    1. Sharon, G. et al. Human gut microbiota from autism spectrum disorder promote behavioral symptoms in mice. Cell177, 1600 (2019). - PMC - PubMed
    1. Lewandowska-Pietruszka, Z., Figlerowicz, M. & Mazur-Melewska, K. Microbiota in autism spectrum disorder: a systematic review. Int. J. Mol. Sci.24, 10.3390/ijms242316660 (2023). - PMC - PubMed
    1. Buffington, S. A. et al. Dissecting the contribution of host genetics and the microbiome in complex behaviors. Cell184, 1740–1756.e1716 (2021). - PMC - PubMed
    1. Sgritta, M. et al. Mechanisms underlying microbial-mediated changes in social behavior in mouse models of autism spectrum disorder. Neuron101, 246 (2019). - PMC - PubMed

MeSH terms