. 2025 Jul 11;16(1):6427.
doi: 10.1038/s41467-025-61568-6.

Arctic Ocean virus communities and their seasonality, bipolarity, and prokaryotic associations

Affiliations

Arctic Ocean virus communities and their seasonality, bipolarity, and prokaryotic associations

Alyzza M Calayag et al. Nat Commun. .

Abstract

Viruses of microbes play important roles in ocean environments as agents of mortality and genetic transfer, influencing ecology, evolution and biogeochemistry. However, we know little about the diversity, seasonality, and host interactions of viruses in polar waters. Here, we study dsDNA viruses in the Arctic Fram Strait across four years via 47 long-read metagenomes of the cellular size-fraction. Among 5662 vOTUs, 98% and 2% are Caudoviricetes and Megaviricetes, respectively. Viral coverage is, on average, 5-fold higher than cellular coverage, and 8-fold higher in summer. Viral community composition shows annual peaks in similarity and strongly correlates with prokaryotic community composition. Using network analysis, we identify putative virus-host interactions and six ecological modules associated with distinct environmental conditions. The network reveals putative novel cyanophages with time-lagged correlations to their hosts (in late summer) as well as diverse viruses correlated with Flavobacteriaceae, Pelagibacteraceae, and Nitrosopumilaceae. Via global metagenomes, we find that 42% of Fram Strait vOTUs peak in abundance in high latitude regions of both hemispheres, and encode proteins with biochemical signatures of cold adaptation. Our study reveals a rich diversity of polar viruses with pronounced seasonality, providing a foundation for understanding viral regulation and ecosystem impacts in changing polar oceans.


Conflict of interest statement

Competing interests: The authors declare no competing interests.

Figures

Fig. 1
Fig. 1. Overview of study site, environmental conditions and viral distributions.
a The mooring site in the West Spitsbergen Current of Fram Strait. b cVCR of viral communities across the two major classes detected and (c) lifestyles during the light and dark cycles from September 2016 to July 2020. d Dynamics of mixed layer depth and temperature which are major community structuring factors. Triangles (top) indicate metagenome sampling points.
Fig. 2
Fig. 2. Intra-and inter-annual viral richness variability.
a To assess differences in sequencing depth, we iteratively subsampled viral read counts from 50 up to 30,000 at 50 count intervals and at each interval determined the mean richness from 100 iterations. The mean richness across subsampled intervals was visualized in a rarefaction-style curve. b Boxplots illustrating the slope of the vOTU richness rarefaction curves up until the chosen subsampling depth (1000 viral reads) where each box encompasses the 25th, median, and 75th percentile, and the whiskers capture the minimum and maximum values of richness estimated from samples collected within the same sampling month. The slopes represent the trajectory of vOTU discovery, and thus indicate how richness may appear if a higher sequencing depth was achieved. The boxplots illustrate the 25%, median and 75% percentile of richness estimations for samples within each sampling month. c vOTU richness at subsampled depth across sampling months. Illustrated values represent the mean (bars) and standard error (error bars) of richness determined from 100 iterations of subsampling (1000 viral read counts per sample).
Fig. 3
Fig. 3. Seasonality of viral communities and their association with environmental conditions.
a Bray-Curtis similarity of Caudoviricetes and Megaviricetes over time. Each point represents the time between two individual sampling points (x-axis) and their similarity (y-axis) for all pairs of samples. The red points indicate the average similarity for 30.5-day (~monthly) intervals. b CCA analysis of viral community composition colored by month, with vectors representing environmental conditions.
Fig. 4
Fig. 4. Viral modules and their association with environmental conditions.
a Sum of cVCR of all vOTUs per module over time; note separate y-axis for M5. b Two-sided Spearman’s rank correlation coefficients between abundances (cVCR) of viral modules and environmental parameters, with significance levels of correlations indicated by asterisks. c Count of prokaryotic and viral members of each major module. d Chord diagram showing the taxonomy of bacterial ASVs in each module. The taxa along the arc are colored based on their corresponding phylum.
Fig. 5
Fig. 5. Cyanophages.
psbA gene phylogeny of cyanophage vOTUs and reference genomes. Support values are reported as aLRT (approximate likelihood ratio test) / BS (maximum likelihood bootstrap). For visualization purposes, “*” indicates branches from this node are scaled 33% of their actual length. b Dynamics of correlated Synechococcus ASVs (top) and cyanophage vOTUs (bottom), along with completion estimates based on CheckV. ** indicates no completion prediction as the vOTU was classified as a provirus.
Fig. 6
Fig. 6. Dynamics of Nitrosopumilaceae and associated viruses.
The shown Nitrosopumilaceae are the most abundant ASVs, which are all members of M5. Different ASVs and vOTUs are shown by different shades of orange and blue, corresponding to M5 and M6 colors, respectively. The shown vOTUs are those that are correlated with Nitrosopumilaceae (p < 0.05) in the  Convergent Cross Mapping network (see Methods, Supplementary Fig. 5a, 6).
Fig. 7
Fig. 7. Global distribution of Fram Strait vOTUs by comparison with short-read (0.2–3 μm size-fraction) metagenomes (Supplementary Data 7).
a Upper and lower map correspond to samples collected within the upper 200 m and deeper than 200 m, respectively. Abundance is calculated as coverage per gigabase pair of sequence (Coverage/Gbp). In the deep map, latitude and longitude were jittered to allow visualization of multiple depths at the same location. b Viral Coverage/Gbp plotted by latitude across all samples along with a Generalized Additive Model prediction, illustrating the trend of total viral Coverage/Gbp by latitude. For more information on samples, see Supplementary Data 1.
Fig. 8
Fig. 8. Viral amino acid traits across environmental gradients.
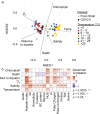
a Nonmetric multidimensional scaling (NMDS) plot showing the environmental diversity of the sampled Fram Strait and GOV2.0 ecosystems. The Bray-Curtis distance similarity matrix was calculated based on the available environmental parameters of 38 Fram Strait and 69 GOV2.0 samples and used to generate NMDS coordinates of each sample. Point shapes represent dataset origin, and colors distinguish different temperature ranges. Vectors show correlations with environmental variables. This ordination provides context for the correlations to environmental parameters of amino acid traits shown in part b. b Heatmap plot illustrating the Spearman correlation coefficients of environmental parameters to amino acid traits, with P values represented by asterisks as indicated. The Spearman coefficients were calculated using a two-sided Mantel test using pairwise distances of each environmental parameter (Euclidean distance) vs. each amino acid trait (Bray-Curtis distance).

References

    1. Overland, J. et al. The urgency of Arctic change. Polar Sci.21, 6–13 (2019).
    1. Post, E. et al. The polar regions in a 2 °C warmer world. Sci. Adv.5, eaaw9883 (2019). - PMC - PubMed
    1. Teng, Z.-J. et al. Biogeographic traits of dimethyl sulfide and dimethylsulfoniopropionate cycling in polar oceans. Microbiome9, 207 (2021). - PMC - PubMed
    1. Garneau, M.-È., Roy, S., Lovejoy, C., Gratton, Y. & Vincent, W. F. Seasonal dynamics of bacterial biomass and production in a coastal arctic ecosystem: Franklin Bay, western Canadian Arctic. J. Geophys. Res. C: Oceans113, C07S91 (2008).
    1. Harding, K. et al. Symbiotic unicellular cyanobacteria fix nitrogen in the Arctic Ocean. Proc. Natl Acad. Sci. USA.115, 13371–13375 (2018). - PMC - PubMed

LinkOut - more resources