. 2025 Jul 11;11(1):207.
doi: 10.1038/s41531-025-01055-3.

Parkinson's paradox: alpha-synuclein's selective strike on SNc dopamine neurons over VTA

Affiliations

Parkinson's paradox: alpha-synuclein's selective strike on SNc dopamine neurons over VTA

L Phan et al. NPJ Parkinsons Dis. .

Abstract

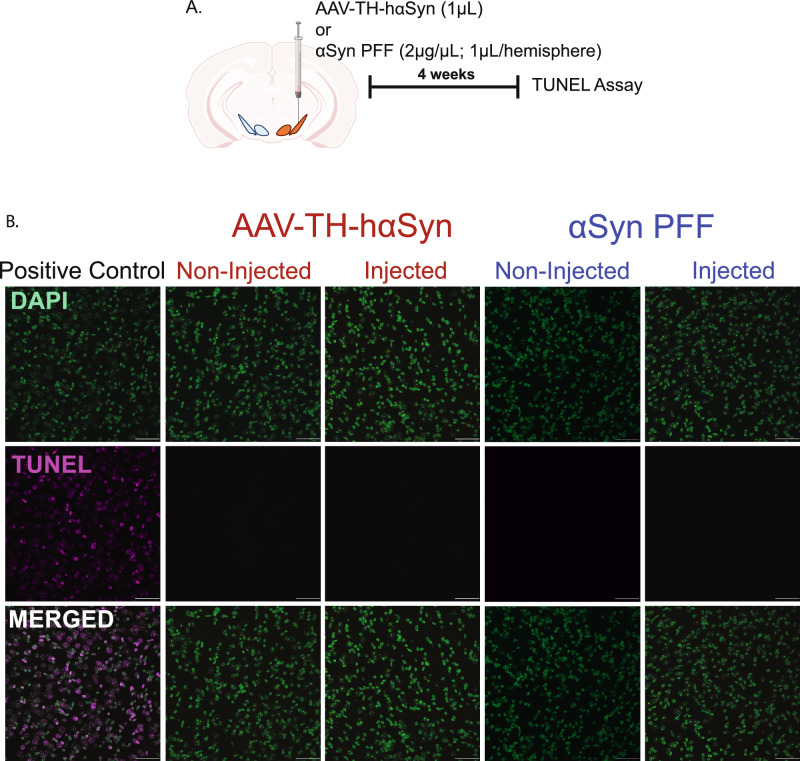
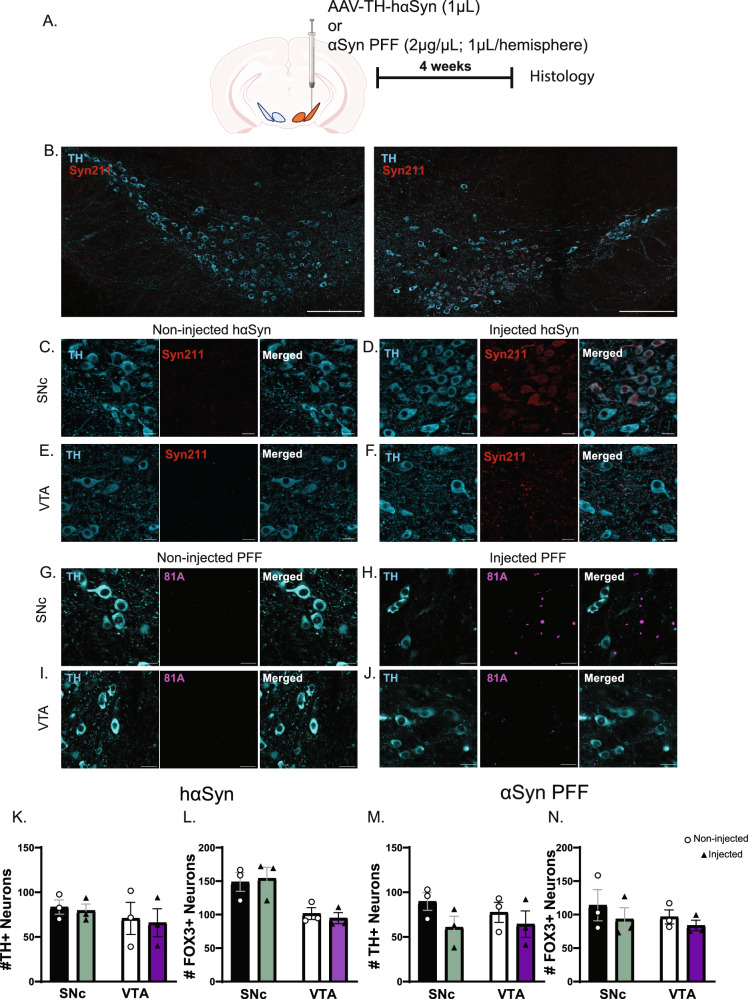
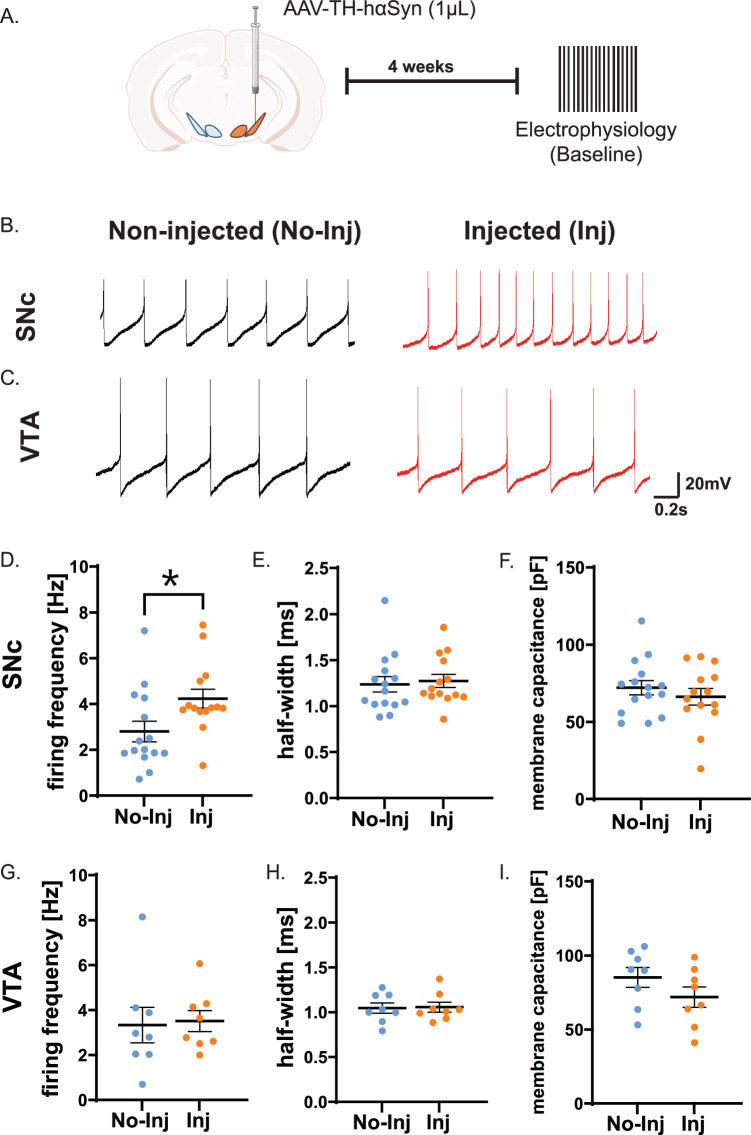
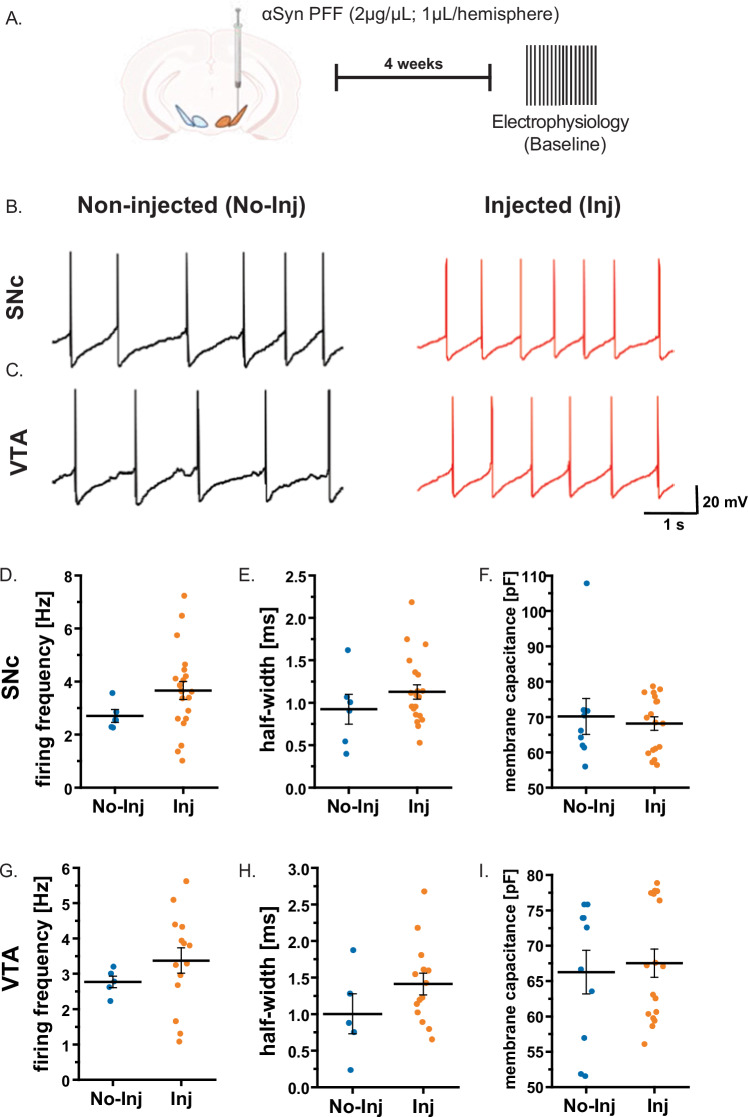
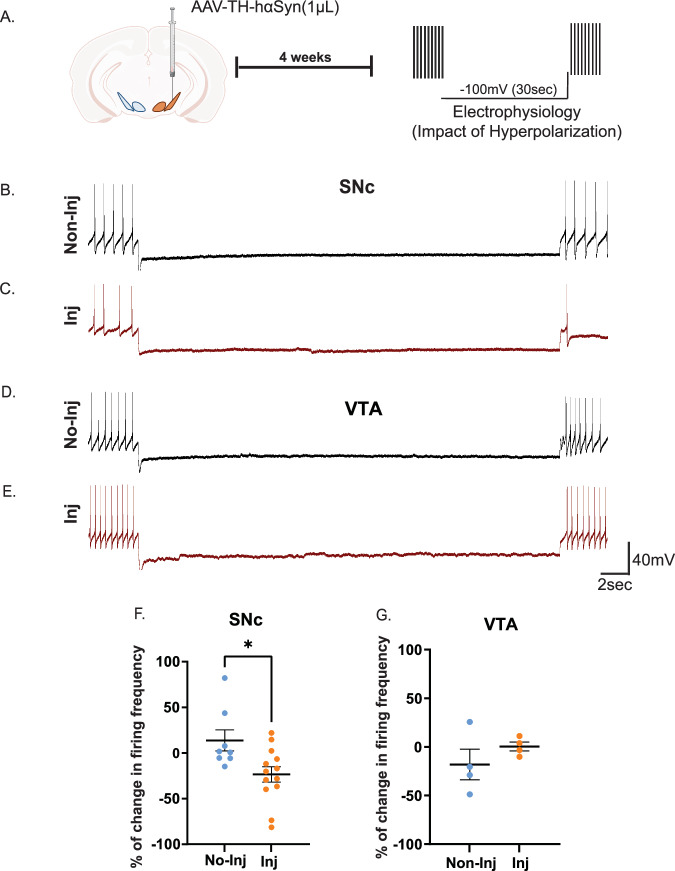
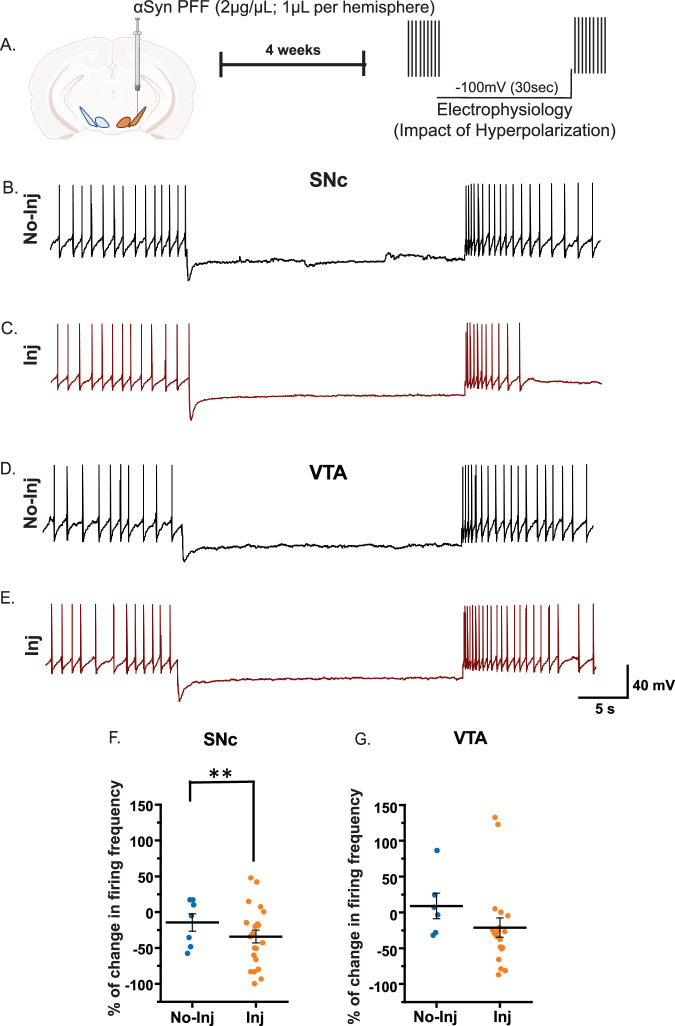
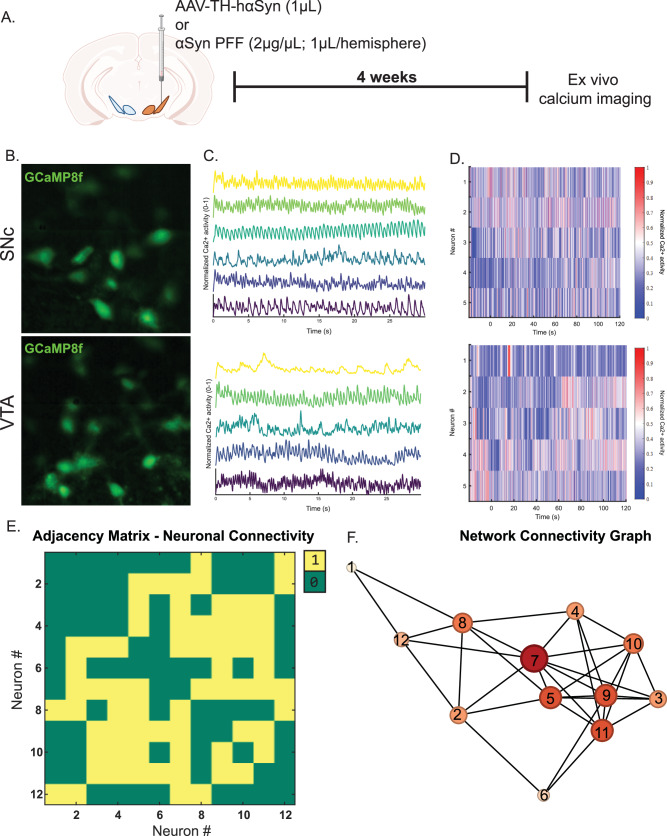
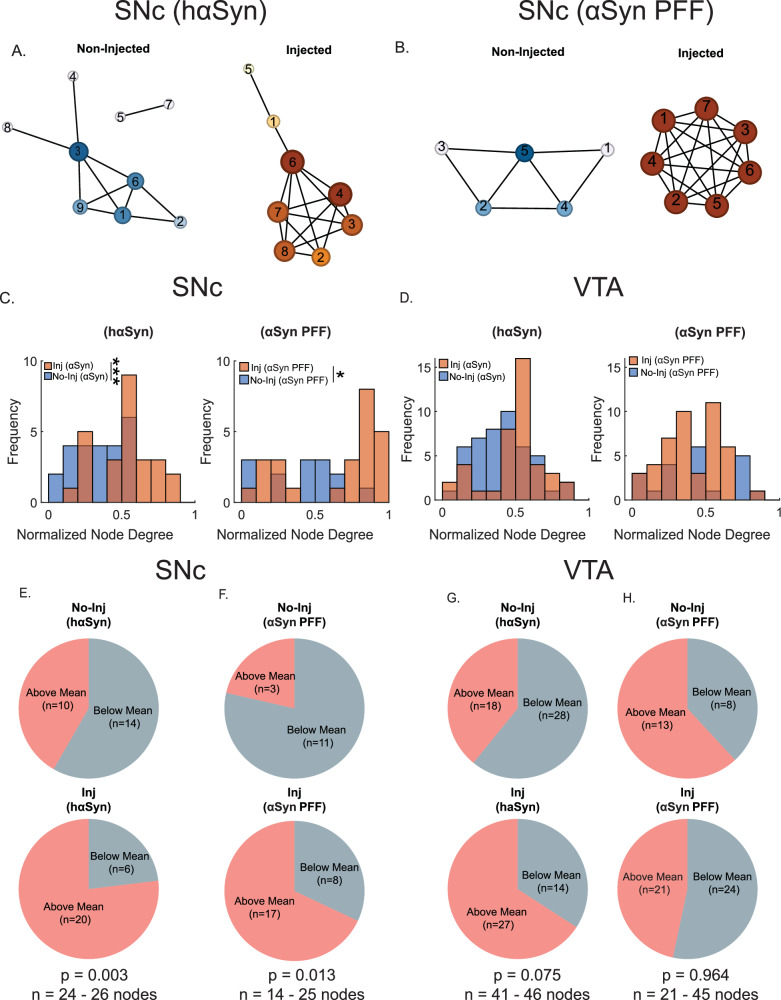
A central question in Parkinson's disease (PD) and related synucleinopathies research is why dopamine neurons in the substantia nigra pars compacta (SNc) are more vulnerable than those in the ventral tegmental area (VTA). We investigated how α-synuclein affects neuronal activity before cell death using two mouse models: α-synuclein preformed fibril injections and AAV-mediated human α-synuclein expression. Four-weeks post-injection, histological analysis confirmed no significant neuronal loss in either structure, providing a temporal window to study neuronal activity before cell death. Electrophysiological recordings revealed region-specific vulnerability: SNc dopamine neurons exhibited significantly increased baseline firing rates while VTA neurons remained unaffected. SNc neurons showed impaired homeostatic firing regulation following hyperpolarization, while VTA neurons maintained normal recovery. Elevated α-synuclein also altered network stability in SNc dopamine neurons before cell death, while sparing VTA neurons. These findings reveal early functional differences that may explain the selective vulnerability of SNc dopamine neurons in PD.


Conflict of interest statement

Competing interests: The authors declare no competing interests.

Figures

Fig. 1
Fig. 1. Assessment of neuronal viability in the VTA and SNc after AAV1-TH-hαSyn and αSyn PFF injections using TUNEL assay.
A Schematic of the experimental design: Mice received injections of AAV1-TH-hαSyn (1 µL) or αSyn PFF (2 µg/µL; 1µL per hemisphere; 0.5µL in the VTA and 0.5µL in the SNc) into the midbrain. Four weeks post-injection, brain sections were processed for TUNEL staining to assess apoptotic cell death. B Representative fluorescent images of DAPI+ nuclei and TUNEL+ cells in positive control and experimental sections. Midbrain sections from the contralateral (non-injected) and the ipsilateral (injected) sides of the AAV1-TH-hαSyn and αSyn PFF injection sites display DAPI+ nuclei but are entirely TUNEL-negative, indicating no detectable apoptotic cell death. This suggests that neurons in the VTA and SNc remain viable at this time point. Scale bar = 20 µm.
Fig. 2
Fig. 2. AAV-TH-hαSyn or αSyn pre-formed fibrils (PFF) increase corresponding immunostaining in the substantia nigra pars compacta (SNc) and ventral tegmental area (VTA).
A Experimental design: Mice received unilateral injections of either AAV1-TH-hαSyn (1 µL) or αSyn PFF (2 µg/1 µL; 1µL per hemisphere; 0.5µL in the VTA and the SNc) into the midbrain. B Representative coronal section of the ventral midbrain (SNc and VTA), showing the AAV1-TH-hαSyn injected (ipsilateral; right) and non-injected (contralateral; left) hemispheres. Four weeks post-injection (C–F), immunostaining with Syn211 (detecting hαSyn) shows colocalization in TH+ neurons on the injected side in the SNc (D) and VTA (F), but not on the non-injected side respectively (C, E). The same timepoint but following injection with αSyn PFF (G-J), 81 A (detecting phosphorylated αSyn aggregates) shows punctate signals localized within TH+ neurons on the injected side in the SNc (H) and VTA (J), but not on the non-injected side respectively (G, I). These data confirm the presence of hαSyn and aggregated αSyn in both the VTA and SNc. K, M Four weeks after injection of either AAV1-TH-hαSyn or αSyn PFF, there was no significant change in the number of TH+ neurons in the SNc or VTA. (L, N) Similarly, no differences were observed in the number of TH+ and FOX3+ neurons in the SNc or VTA. Error bars represent mean ± SEM. (n = 3 independent biological replicates, one-way ANOVA and t-test, *p < 0.05) Scale bars: 250 µm (B); 20 µm (CJ).
Fig. 3
Fig. 3. hαSyn alters the electrophysiological properties of dopaminergic neurons in the SNc but not in the VTA dopamine neurons.
A Schematic representation of the experimental design for single-neuron recordings conducted 4 weeks post hαSyn injection (1 µL) into the midbrain. B Representative electrophysiological traces from SNc dopamine neurons in the non-injected (no- inj) and hαSyn-injected (inj) sides. D The basal firing frequency of SNc dopamine neurons is significantly increased on the ipsilateral side post-hαSyn injection. C Representative traces from VTA dopamine neurons on the contralateral and ipsilateral sides, and quantification in G demonstrating that hαSyn injection does not alter the basal firing frequency of VTA dopamine neurons. E, F Bar graphs depicting the half-width and membrane capacitance of SNc dopamine neurons, respectively. H, I Bar graphs depicting the half-width and membrane capacitance of VTA dopamine neurons, respectively. Error bars represent the mean ± SEM. Data were obtained from 3 - 4 mice, resulting in a sample size of n = 8 - 15 neurons. Statistical significance was determined using a t-test (*p < 0.05).
Fig. 4
Fig. 4. The presence of αSyn PFF does not change the electrophysiological properties of dopaminergic neurons in the SNc or VTA dopamine neurons.
A Schematic representation of the experimental design for single-neuron recordings conducted 4 weeks post-unilateral αSyn PFF deposition (2 µg/µL; 1µL per hemisphere; 0.5µL in the SNc and 0.5µL in the VTA) into the midbrain. B Representative electrophysiological traces from SNc dopamine neurons in the non-injected (no-inj) and PFF-injected (inj) sides. D The basal firing frequency of SNc dopamine neurons is similar in αSyn PFF-injected and non-injected mice. C Representative traces from VTA dopamine neurons from PFF-injected and non-injected side with quantification in G demonstrate that αSyn PFF injection does not alter the basal firing frequency of VTA dopamine neurons. E, F, H, I Bar graphs depicting the half-width and membrane capacitance of SNc and VTA dopamine neurons. Error bars represent the mean ± SEM. Data were obtained from 4-6 mice, resulting in a sample size of n = 5 - 21 neurons. Statistical significance was determined using a t-test.
Fig. 5
Fig. 5. hαSyn overexpression compromises the resilience of SNc dopamine neurons to hyperpolarization challenge.
A Experimental design: Four weeks after unilateral hαSyn injection (1 µL), basal firing frequency of SNc dopamine neurons was recorded both ipsilaterally (injected side; inj) and contralaterally (non-injected side; no-inj). Neurons were then hyperpolarized to –100 mV for 30 second. Following restoration of the resting membrane potential, post stress firing frequency was assessed to determine resilience to hyperpolarization. B, C Representative electrophysiological traces from SNc dopamine neurons before and after the 30-second hyperpolarization step. F The accompanying graph shows the percentage change in firing frequency, revealing a diminished capacity of SNc neurons to recover following hyperpolarization stress in the presence of hαSyn. D, E Representative traces from VTA dopamine neurons at baseline and post-hyperpolarization. G The associated graph demonstrates that VTA neurons effectively buffer the hyperpolarization-induced perturbation, maintaining firing rates without significant changes after hαSyn overexpression. Error bars represent mean ± SEM. Data was obtained from 3-4 mice, with a sample size of n = 4 - 13 neurons. Statistical significance was assessed by t-test (*p < 0.05).
Fig. 6
Fig. 6. αSyn PFF deposition impairs the resilience of SNc dopamine neurons to hyperpolarization challenge.
A Experimental design: Four weeks post unilateral αSyn PFF deposition (2 µg/µL; 1µL per hemisphere; 0.5µL in the SNc and 0.5µL in the VTA), the basal firing frequency of SNc dopamine neurons was recorded both ipsilaterally (injected side; inj) and contralaterally (non-injected side; no-inj). Neurons were then hyperpolarized to –100 mV for 30 s. After returning to resting membrane potential, post-stress firing frequency was measured to assess resilience. B, C Representative electrophysiological traces from SNc dopamine neurons before and after the 30-second hyperpolarization step. F The corresponding graph quantifies the percentage change in firing frequency, showing a reduced capacity of SNc neurons to recover following hyperpolarization stress when exposed to αSyn PFF. (D, E) Representative traces from VTA dopamine neurons at baseline and post-hyperpolarization. G The associated graph indicates that VTA neurons maintain stable firing frequencies and remain unaffected by PFF deposition under these conditions. Error bars represent mean ± SEM. Data were obtained from  4–6 mice, resulting in a sample size of n = 6 - 22 neurons. Statistical significance was determined by t-test (**p < 0.01).
Fig. 7
Fig. 7. Investigating hαSyn- and PFF-induced regulation of dopamine neuronal network connectivity in the SNc and VTA.
A Schematic representation of the experimental design: DAT:cre mice were bilaterally injected with AVV5:FLEx-GCaMP8f (300 nL) for live cell calcium imaging and unilaterally received AAV-TH-hαSyn (1 µL) or αSyn PFF (2 µg/µL; 1µL per hemisphere; 0.5µL in the SNc and 0.5µL in the VTA). B Representative GCaMP8f-labeled dopamine neurons. C Normalized calcium traces from dopamine neurons in the SNc (top) and VTA (bottom). D Raster plots of neuronal firing activity show temporal patterns of calcium signaling in individual dopamine neurons. E Adjacency matrices illustrating neuronal connectivity, where “1” denotes a connection between two neurons and “0” denotes no connection. F Network connectivity graphs derived from adjacency matrices. Each node represents an individual neuron, with the size and intensity of color indicating the number of connections for that neuron (greater size, larger number of connections and darker color reflect higher connectivity). These analyses highlight the differential network connectivity of dopamine neurons in the SNc and VTA under conditions of hαSyn or αSyn PFF exposure.
Fig. 8
Fig. 8. Both hαSyn expression and αSyn PFF deposition increase hyperconnectivity in the SNc, but not the VTA.
A Left panel: Network graphs of the SNc for non-injected and the hαSyn-injected hemispheres (AAV-TH-hαSyn, 1 µL). B Network graphs of the SNc for non-injected and the αSyn PFF-injected hemispheres (PFF, 2 µg/µL; 1µL per hemisphere; 0.5µL in the SNc and 0.5µL in the VTA). C Bar graphs of the frequencies of normalized node strengths in non-injected versus hαSyn- or αSyn PFF-injected SNc. D Bar graphs of the frequencies of normalized node degree in non-injected versus hαSyn- or αSyn PFF-injected VTA. EH Pie graphs of the frequencies of the node strength above the mean of non-injected and hαSyn- or αSyn PFF-injected side in the SNc and VTA. Data was collected from 3 - 5 mice with a sample size ranging from n = 14–46 nodes (t-test, *p < 0.05, ***p < 0.001).

Update of

Similar articles

References

    1. Giasson, B. I. & Lee, V. M. Are ubiquitination pathways central to Parkinson’s disease? Cell114, 1–8 (2003). - PubMed
    1. Braak, H. et al. Staging of brain pathology related to sporadic Parkinson’s disease. Neurobiol. Aging24, 197–211 (2003). - PubMed
    1. Gao, V., Briano, J. A., Komer, L. E. & Burré, J. Functional and Pathological Effects of α-Synuclein on Synaptic SNARE Complexes. J. Mol. Biol.435, 167714 (2023). - PMC - PubMed
    1. Burré, J. The Synaptic Function of α-Synuclein. J. Parkinsons Dis.5, 699–713 (2015). - PMC - PubMed
    1. Somayaji, M. et al. A dual role for α-synuclein in facilitation and depression of dopamine release from substantia nigra neurons in vivo. Proc. Natl. Acad. Sci. USA117, 32701–32710 (2020). - PMC - PubMed

LinkOut - more resources