. 2025 Jul 11;9(1):236.
doi: 10.1038/s41698-025-00947-0.

Lestaurtinib's antineoplastic activity converges on JAK/STAT signaling to inhibit treatment naïve and therapy resistant forms ovarian cancer

Affiliations

Lestaurtinib's antineoplastic activity converges on JAK/STAT signaling to inhibit treatment naïve and therapy resistant forms ovarian cancer

Esther P B Rodman et al. NPJ Precis Oncol. .

Abstract

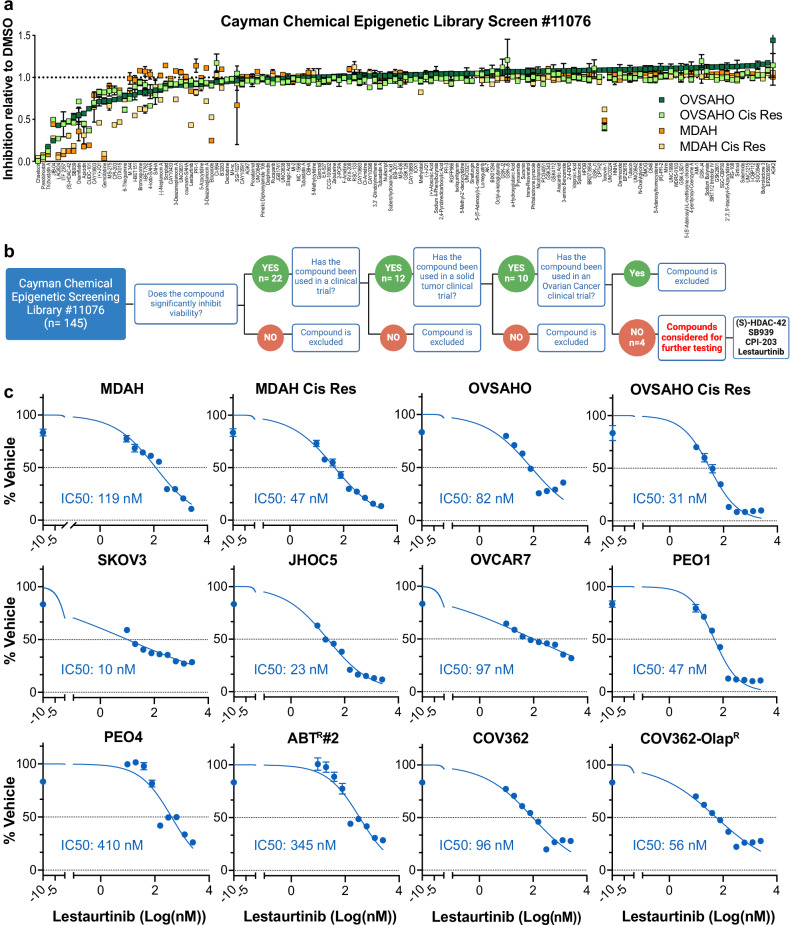
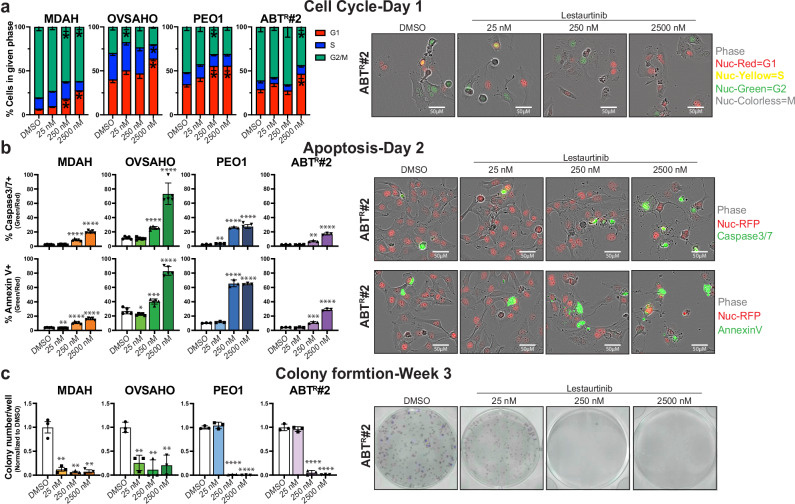
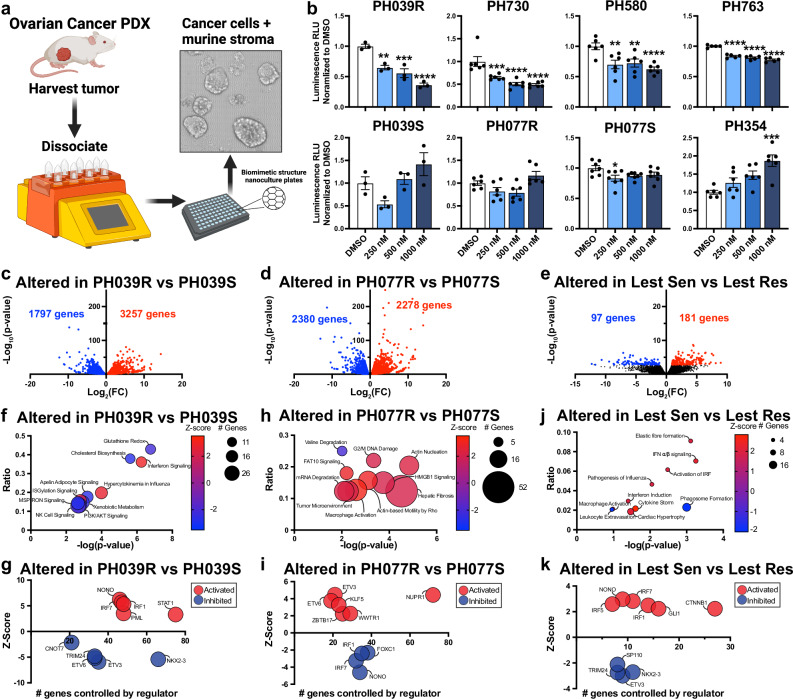
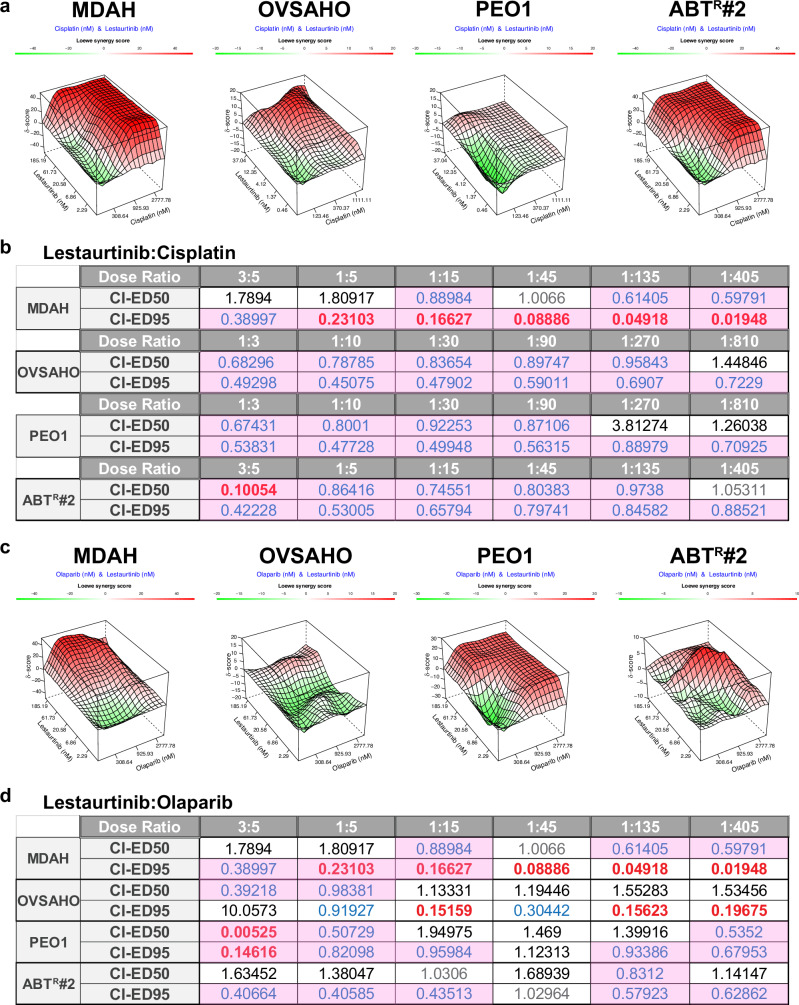
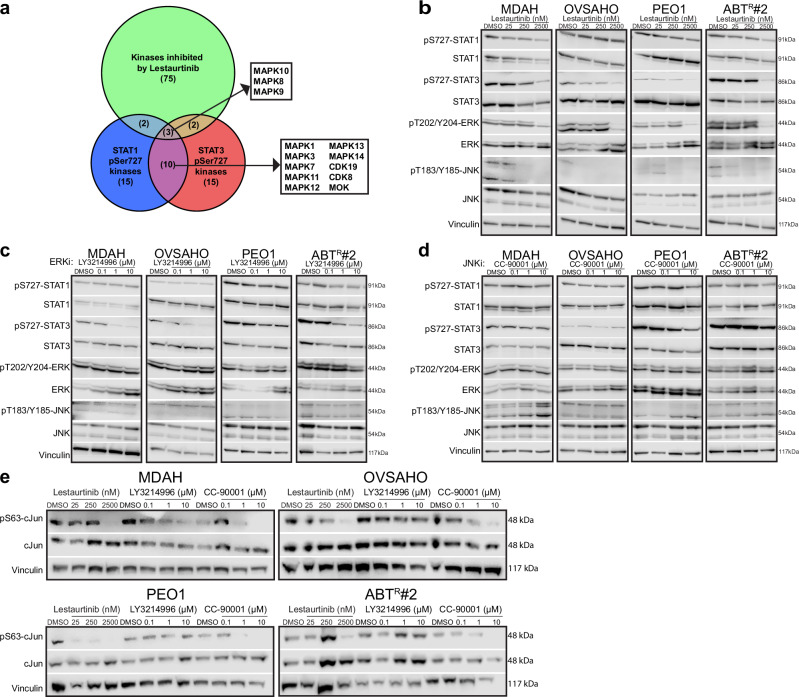
Ovarian cancer is the deadliest gynecological malignancy, owing to its late-stage diagnosis and high rates of recurrence and resistance following standard-of-care treatment, highlighting the need for novel treatment approaches. Through an unbiased drug screen, we identified the kinase inhibitor, lestaurtinib, as a potent antineoplastic agent for chemotherapy- and PARP-inhibitor (PARPi)-sensitive and -resistant ovarian cancer cells and patient derived xenografts (PDXs). RNA-sequencing revealed that lestaurtinib potently suppressed JAK/STAT signaling and lestaurtinib efficacy was shown to be directly related to JAK/STAT pathway activity in cell lines and PDX models. Most ovarian cancer cells exhibited constitutive JAK/STAT pathway activation and genetic loss of STAT1 and STAT3 resulted in growth inhibition. Lestaurtinib also displayed synergy when combined with cisplatin and olaparib, including in a model of PARPi resistance. In contrast, the most well-known JAK/STAT inhibitor, ruxolitinib, lacked antineoplastic activity against all ovarian cancer cell lines and PDX models tested. This divergent behavior was reflected in the ability of lestaurtinib to block both Y701/705 and S727 phosphorylation of STAT1 and STAT3, whereas ruxolitinib failed to block S727. Consistent with these findings, lestaurtinib additionally inhibited the serine/threonine kinases, JNK and ERK, leading to more complete suppression of STAT phosphorylation. Concordantly, combinatorial treatment with ruxolitinib and a JNK or ERK inhibitor resulted in synergistic antineoplastic effects at dose levels where the single agents were ineffective. Taken together, these findings indicate that lestaurtinib, and other treatments that converge on JAK/STAT signaling, are worthy of further pre-clinical and clinical exploration for the treatment of highly aggressive and advanced forms of ovarian cancer.


Conflict of interest statement

Competing interests: The authors declare no competing interests.

Figures

Fig. 1
Fig. 1. Identification of lestaurtinib as a novel inhibitor of therapy-sensitive and -resistant ovarian cancer cells.
a Viability of indicated cell lines following 48 h of treatment with 1 µM of the 145 compounds contained in the Cayman Chemical epigenetic drug library (#11076) relative to DMSO vehicle. N = 2. b Drug screen hit prioritization schema. Figure created with BioRender.com. c Dose response curves (two-fold dilution starting at 2.5 µM) and IC50 concentrations for lestaurtinib in a panel of therapy-sensitive and -resistant ovarian cancer cell lines following 5–10 days of treatment. N = 8. Graphs represent mean ± standard error. Abbreviations: Cis Res cisplatin-resistant, OlapR olaparib-resistant.
Fig. 2
Fig. 2. Lestaurtinib induces cell cycle arrest, apoptosis, and prevents colony formation.
a Indicated cell lines expressing a fluorescent cell cycle reporter were treated with multiple concentrations of lestaurtinib for 24 h and cell cycle phase distribution was monitored. The percentage of cells in each phase of the cell cycle was quantified via the IncuCyte S3 system based on the presence of nuclear red (G1), nuclear green (G2/M) and nuclear yellow (S). Representative images of the ABTR#2 cell line are shown. N = 5–8. Graphs represent mean ± standard error. ANOVA p-values compared to DMSO for each cell cycle stage: *<0.0332. b Nuc Red expressing cells were incubated with Caspase 3/7-GFP or Annexin V-GFP reporters and subsequently treated with lestaurtinib for 2 days. Percent apoptotic cells were defined as # green positive cells relative to # of red positive cells. Representative images of the ABTR#2 cell line are shown. N = 3–5. c Colony formation was assessed in the indicated cell lines following 3 weeks of treatment with multiple concentrations of lestaurtinib and the number of colonies were quantified by crystal violet staining. N = 3. Representative images of the ABTR#2 cell line are shown. Abbreviations: Nuc nuclear. Graphs represent mean ± standard error. ANOVA p-values: *<0.0332,**<0.0021,***<0.0002,****<0.0001.
Fig. 3
Fig. 3. Lestaurtinib inhibits JAK/STAT signaling.
Volcano plots depicting differentially expressed genes in (a) MDAH and (b) OVSAHO cells, where blue indicates downregulated and red indicates upregulated genes ( | fold change | ≥ 1.5, p < 0.05 and FDR < 0.1). The number of of significantly regulated genes are indicated. Bubble plots depicting significantly regulated pathways following lestaurtinib treatment of (c) MDAH and (d) OVSAHO cells as identified by Ingenuity Pathway Analysis. Bubble blots depicting predicted upstream regulators that likely contribute to lestaurtinib mediated differential gene expression in (e) MDAH and (f) OVSAHO cells. g PCA plot generated from RNAseq results of MDAH and OVSAHO cells treated with vehicle and lestaurtinib. h Venn diagram depicting the overlap of lestaurtinib regulated genes in MDAH and OVSAHO cells. i Line graph showing concordance/discordance of the 161 commonly regulated by lestauritnib in both MDAH and OVSAHO cell lines. Abbreviations: Lest lestaurtinib, Veh vehicle. Pathways and regulators with p < 0.05 and |z-score | > 2 are shown.
Fig. 4
Fig. 4. Efficacy of lestaurtinib in ex vivo PDX models.
a Depiction of ovarian cancer PDX processing for rapid evaluation of drug efficacy in ex vivo cultures. Created with BioRender.com. b Viability of PDX models following 3 days of lestaurtinib treatment as assessed via 3D CellTiter-Glo. N = 3–6. Volcano plots depicting differentially expressed genes in (c) PH039R vs PH039S, d PH077R vs PH077S, and e lestaurtinib sensitive (PH039R, PH730, PH580) vs lestaurtinib resistant (PH039S, PH077S, PH077R, PH354) PDXs as determined by RNAseq, where blue indicates significantly downregulated genes and red indicates significantly upregulated genes ( | fold change | ≥ 1.5, p < 0.05 and FDR < 0.1). The number of significantly regulated genes are shown. f–k Ingenuity Pathway Analysis and upstream regulator assessment of differentially expressed genes between the indicated PDX models. Pathways and up-stream regulators with p < 0.05 and |z-score | > 2 were considered as significant. Abbreviations: Lest lestaurtinib, Sen sensitive, Res resistant. Graphs depict mean ± standard error. ANOVA p-values: *<0.0332,**<0.0021,***<0.0002,****<0.0001.
Fig. 5
Fig. 5. STAT1 and STAT3 are constitutively active and growth promoting in ovarian cancer cells.
a Relative mRNA expression levels of primary JAK/STAT family members in normal fallopian tube epithelial cells (FT194, FT282) and ovarian cancer cell lines under normal growth conditions. b Western blots depicting the total protein and phosphorylation levels of primary JAK/STAT signaling components in indicated cell lines under normal growth conditions. Actin and vinculin served as loading controls. c Western blots depicting the levels of STAT1 and STAT3 phosphorylation in response to 10 ng/mL IFNγ and increasing concentrations of lestaurtinib for 30 min. Actin served as the loading control. d Western blots depicting total STAT1 and STAT3 protein following 72 h treatment with scrambled control, STAT1 or STAT3 siRNA. Actin served as the loading control. e Relative cell proliferation rates in response to siRNA-mediated STAT1 or STAT3 knockdown 5 days after transfection. N = 5–10. f Representative brightfield images depicting cell density 5 days post-transfection. g Western blots depicting total STAT1 and STAT3 protein levels in MDAH and OVSAHO parental, STAT1 (S1) and STAT3 (S3) CRISPR knockout (KO) cells. Actin served as the loading control. h Relative proliferation rates of control, STAT1 and STAT3 KO cells and i representative brightfield images depicting cell density 5 days after plating. N = 8–10. j STAT1 and STAT3 essentiality in a panel of 59 ovarian cancer cell lines assessed via RNAi or CRISPR KO screens from the DepMap database. Gene Effect <0 indicates dependency, <-1 indicates essentiality. Abbreviations: Par parental, Cis Res cisplatin resistant, OlapR olaparib-resistant, Con control, WT wildtype, KO knockout, S1 STAT1, S3 STAT3. Graphs depict mean ± standard error. ANOVA p-values: *<0.0332,**<0.0021,***<0.0002,****<0.0001.
Fig. 6
Fig. 6. Lestaurtinib synergizes with cisplatin and olaparib.
Indicated cells were treated with cisplatin (25,000 nM or 10,000 nM, threefold dilution) or olaparib (25000 nM, threefold dilution), alone and in combination with lestaurtinib (5000 nM or 1000 nM, threefold dilution), for 5–7 days. Relative cell viability was measured with crystal violet staining. a, c Synergy plots depicting Loewe scores generated using SynergyFinder3.0. b, d Combination index (CI) scores were calculated using the Chou-Talalay method and Compusyn software. CI-ED50 = combination index at 50% fraction effected, CI-ED95 = combination index at 95% fraction effected, where the fraction effected represents precent cell death. Antagonism = >1 (black), additive = 1 (gray), synergy = < 1 (blue), and highly synergistic = < 0.3 (red). Pink highlighting = synergism identified using clinically achievable concentrations of both drugs.
Fig. 7
Fig. 7. Comparison of lestaurtinib and ruxolitnib effects on ovarian cancer inhibition and regulation of JAK/STAT signaling.
a Dose response curves (twofold dilution starting at 200 µM) and IC50 concentrations for ruxolitinib in a panel of therapy-sensitive and -resistant ovarian cancer cell lines following 5–10 days of treatment. N = 8. b Viability of PDX models following 3 days of ruxolitinib treatment ex vivo as assessed via 3D CellTiter-Glo. N = 3–6. c Expression of indicated STAT1 and STAT3 regulated genes following 24 h of treatment with DMSO, 250 nM lestaurtinib or 250 nM ruxolitinib. d Western blots depicting the levels of STAT1 and STAT3 phosphorylation following treatment with DMSO or indicated concentrations of lestaurtinib and ruxolitinib for 30 min. Actin served as the loading control. Abbreviations: Cis Res cisplatin resistant, OlapR olaparib-resistant, Lest lestaurtinib, Ruxo ruxolitinib. Graphs depict mean ± standard error. ANOVA p-values: *<0.0332,**<0.0021,***<0.0002,****<0.0001.
Fig. 8
Fig. 8. Lestaurtinib inhibits ERK and JNK leading to blockade of STAT S727 phosphorylation.
a Venn diagram of kinases known to be inhibited by lestaurtinib and predicted to phosphorylate S727 of STAT1 and/or STAT3. Western blots depicting total and phosphorylated levels of STAT1, STAT3, ERK and JNK following 30 min of (b) lestaurtinib, c LY3214996 (ERKi) or d CC-90001 (JNKi) treatment. e Western blots depicting total and phosphorylated levels of cJUN following 30 mins of lestaurtinib, LY3214996 (ERKi), or CC-90001 (JNKi) treatment. Vinculin served as the loading control.
Fig. 9
Fig. 9. Ruxolitinib synergizes with LY3214996 (ERKi) and CC-90001 (JNKi).
Indicated cells were treated with LY3214996 (70 µM, threefold dilution) or CC-90001 (70 µM, threefold dilution), alone and in combination with ruxolitinib (25 µM, threefold dilution) for 5–7 days. Relative cell viability was measured with crystal violet staining. a, c Synergy plots depicting Loewe scores were generated using SynergyFinder3.0. b, d Combination index (CI) scores were calculated using the Chou-Talalay method and Compusyn software. CI-ED50 = combination index at 50% fraction effected, CI-ED95 = combination index at 95% fraction effected, where the fraction effected represents precent cell death. Antagonism = >1 (black), additive = 1 (gray), synergy = <1 (blue), and highly synergistic = <0.3 (red). Pink highlighting = synergism identified using clinically achievable concentrations of both drugs.

Update of

References

    1. Siegel, R. L., Giaquinto, A. N. & Jemal, A. Cancer statistics, 2024. CA Cancer J. Clin.74, 12–49 (2024). - PubMed
    1. Wei, W. et al. Clinical outcome and prognostic factors of patients with early-stage epithelial ovarian cancer. Oncotarget8, 23862–23870 (2017). - PMC - PubMed
    1. Doubeni, C. A., Doubeni, A. R. & Myers, A. E. Diagnosis and management of ovarian cancer. Am. Fam. Physician93, 937–944 (2016). - PubMed
    1. Morgan, R. J. Jr. et al. Ovarian cancer, version 1.2016, NCCN clinical practice guidelines in oncology. J. Natl. Compr. Canc Netw.14, 1134–1163 (2016). - PubMed
    1. Colombo, N. et al. ESMO-ESGO consensus conference recommendations on ovarian cancer: pathology and molecular biology, early and advanced stages, borderline tumours and recurrent disease. Dagger Ann. Oncol.30, 672–705 (2019). - PubMed

LinkOut - more resources