. 2025 Jul 11;15(1):25039.
doi: 10.1038/s41598-025-10354-x.

Comprehensive analysis of Mendelian randomization and scRNA-seq identify key prognostic genes and relevant functional roles in colorectal cancer

Affiliations

Comprehensive analysis of Mendelian randomization and scRNA-seq identify key prognostic genes and relevant functional roles in colorectal cancer

Meng Hu et al. Sci Rep. .

Abstract

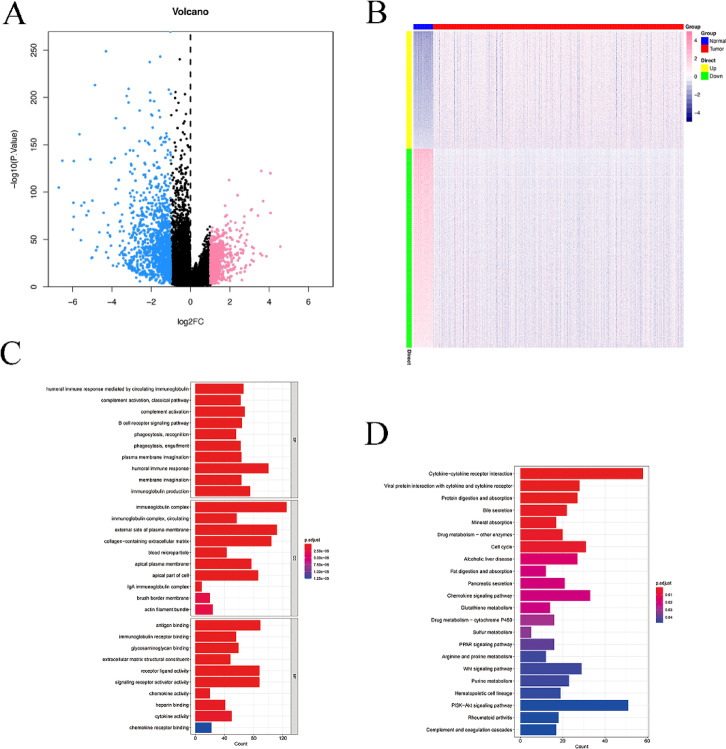
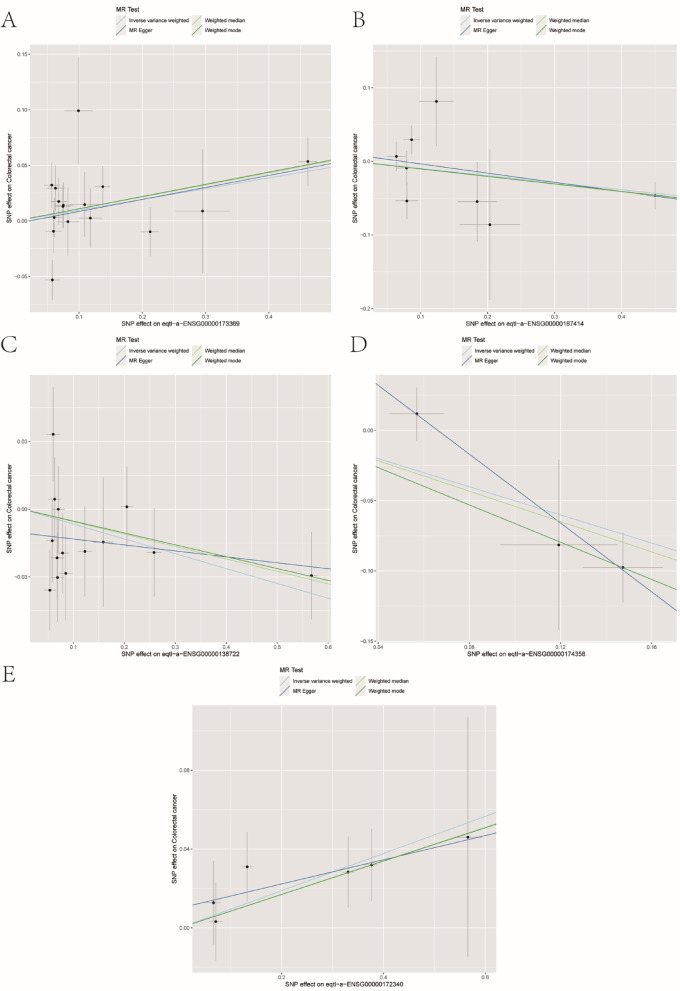
The prognosis of advanced CRC is poor, and identifying key genes related to CRC is vital for improving CRC prognosis. Our research used univariate Cox analysis and Mendelian randomization (MR) analysis to identify key prognostic genes in CRC. Multiple datasets such as the nomogram model and single-cell sequencing (scRNA-seq) were used to investigate the potential molecular mechanisms of the key genes. The expression levels were confirmed by using quantitative real-time polymerase chain reaction (qRT-PCR). The biological functions and effect on prognosis of the identified prognostic genes were also explored. MMRN1 and SLC6A19 were identified as key prognostic genes for CRC. Subsequently, the nomogram model demonstrated that MMRN1 and SLC6A19 can strongly predict survival. Further examination with multiple datasets elucidated the potential molecular mechanisms of the key prognostic genes, revealing a close association with immune cell infiltration. MMRN1 is enriched in classic CRC signaling pathways, whereas SLC6A19 is enriched in metabolism-related pathways. They are closely linked to immune cell infiltration levels and significantly influence the immune microenvironment in CRC. These key prognostic genes are significantly correlated with chemotherapeutic drug sensitivity and present promising opportunities for CRC therapy. The expression of both key genes was also observed in the scRNA-seq data of CRC. Finally, qRT-PCR validation revealed that MMRN1 is markedly downregulated and SLC6A19 is significantly upregulated in CRC. Lower expression of MMRN1 and higher expression of SLC6A19 significantly promoted the proliferation and metastasis of colorectal cancer cells. Our study identified MMRN1 and SLC6A19 as potential key prognostic genes for CRC, as they can reliably predict the prognosis of CRC. Furthermore, the potential molecular mechanisms of MMRN1 and SLC6A19 were revealed, suggesting new drug targets and therapeutic directions for managing prognosis.

Keywords: MMRN1; SLC6A19; Colorectal cancer; Immune microenvironment; Mendelian randomization; Prognosis; Single-cell RNA sequencing.


Conflict of interest statement

Declarations. Competing interest: The authors declare no competing interests. Ethical approval and consent to participate: The Ethics Committee of the First Affiliated Hospital of Ningbo University granted approval for this project (No.KY20220101). All human studies were carried out in accordance with the principles of the Declaration of Helsinki. Written informed consent was obtained from the patients.

Figures

Fig. 1
Fig. 1
Differential expression and univariate analyses. (A) The differentially expressed genes between the normal group and the tumor group were visualized through volcano plot. (B) Heatmap illustrating the differentially expressed genes between the normal and tumor groups. (C) Clustered bar chart of GO enrichment analysis revealed that the prognosis genes were predominantly involved in pathways including complement activation, the classical pathway, the B-cell receptor signaling, and the immunoglobulin complex. (D) Clustered bar chart of KEGG enrichment analysis revealed that the prognostic genes were primarily associated with pathways such as cytokine-cytokine receptor interactions, protein digestion and absorption, and the cell cycle.
Fig. 2
Fig. 2
MR analysis of exposure and outcome factors. (A) Scatter plot demonstrating the causal relationship between C1QB and its corresponding eQTL-positive outcome. (B) Scatter plot showing the causal relationship between GNG8 and its corresponding eQTL-positive outcome. (C) Scatter plot illustrating the causal relationship between MMRN1 and its corresponding eQTL-positive outcome. (D) Scatter plot demonstrating the causal relationship between SLC6A19 and its corresponding eQTL-positive outcome. (E) Scatter plot showing the causal relationship between SUCLG2 and its corresponding eQTL-positive outcome.
Fig. 3
Fig. 3
Validation of MR analysis through the leave-one-out method. (A) Leave-one-out forest plot for C1QB with its corresponding positive result. (B) Leave-one-out forest plot for GNG8 with its corresponding positive result. (C) Leave-one-out forest plot for MMRN1 with its corresponding positive result. (D) Leave-one-out forest plot for SLC6A19 with its corresponding positive result. (E) Leave-one-out forest plot for SUCLG2 with its corresponding positive result.
Fig. 4
Fig. 4
eQTL-GWAS colocalization analysis. (A) The colocalization analysis of MMRN1 was conducted at the eQTL-GWAS level, and the results showed the colocalization of MMRN1 with SNP.PP. H4 exceeded 0.6. (B) The colocalization analysis of SLC6A19 was conducted at the eQTL-GWAS level, and the colocalization of SLC6A19 with SNP.PP. H4 exceeded 0.6.
Fig. 5
Fig. 5
Analysis of drug sensitivity and prognosis prediction in CRC patients. (A) Nomogram for predicting the prognosis of CRC. (B) Calibration curve for survival rate prediction in CRC patients. The nomogram-predicted overall survival (OS) is on the x-axis, with the observed OS on the y-axis. (C) ROC curve of MMRN1 for predicting the onset and progression of CRC. The peak ROC value was 0.974 (95% CI, 0.962–0.986). (D) ROC curve of SLC6A19 for predicting the onset and progression of CRC. The peak ROC value was 0.953 (95% CI, 0.929–0.977). (E) Analysis of MMRN1 sensitivity to common chemotherapy drugs. (F) Analysis of SLC6A19 sensitivity to common chemotherapy drugs.
Fig. 6
Fig. 6
Exploring the biological significance of immune cell infiltration pattern. (A) Stacked bar plots depict the relative proportions of the 22 tumor-infiltrating immune cell subtypes in each sample. (B) Associations between 22 tumor-infiltrating immune cells. (C) The number of active memory CD4 T cells, resting NK cells, M0 macrophages, M1 macrophages, and mast cells was significantly increased in CRC patients compared with the normal group. (D) The lollipop chart showed that MMRN1 was strongly positively correlated with M2 macrophages, static mast cells and naive B cells, and significantly negatively correlated with activated mast cells, M0 macrophages and static NK cells. (E) The lollipop chart showed that SLC6A19 was significantly positively correlated with static mast cells, plasma cells and naive B cells, and significantly negatively correlated with M0 macrophages, static NK cells and activated mast cells.
Fig. 7
Fig. 7
Correlation analysis of key genes and various types of immune factors. (A) MMRN1 and SLC6A19 are significantly correlated with chemokines. (B) MMRN1 and SLC6A19 are deeply correlated with immunostimulatory factors. (C) MMRN1 and SLC6A19 are correlated with immune inhibitory factors. (D) MMRN1 and SLC6A19 are significantly correlated with MHC molecules. (E) MMRN1 and SLC6A19 are greatly correlated with receptors.
Fig. 8
Fig. 8
Enrichment analysis of key gene specific signaling pathways. (A) The GSEA results of MMRN1 showed significant enrichment of the oxytocin signaling pathway, relaxin signaling pathway and TGF-β signaling pathway, and showed high activity in CRC group. (B) Oxytocin signaling pathway, relaxin signaling pathway and TGF-β signaling pathway were enriched gene sets, DCN, GREM1 and other genes were more prominent. (C) GSEA results of SLC6A19 showed significant enrichment of galactose metabolism, retinol metabolism and tyrosine metabolism pathways, and showed high activity in CRC group. (D) Gene sets enriched in the pathways of galactose metabolism, retinol metabolism and tyrosine metabolism, with ADH1C and other genes prominent. (E) The GSVA pathway enrichment analysis of MMRN1 showed significant enrichment of IL2/STAT5 signaling pathway, IL6/JAK/STAT3 signaling pathway and Notch signaling pathway. (F) The GSVA pathway enrichment analysis of SLC6A19 showed significant enrichment of bile acid metabolism, xenobiotic metabolism, and allograft rejection pathways.
Fig. 9
Fig. 9
Single-cell sequencing. (A) tSNE map of the single-cell profile, color-coded according to subtype. (B) t-SNE plot for seven postannotation cell types, color-coded based on cell type. (C) Expression of MMRN1 and SLC6A19 cell type marker genes. (D) Expression levels of MMRN1 and SLC6A19 across seven cell types.
Fig. 10
Fig. 10
Expression and biological function of MMRN1, SLC6A19 in CRC. (A) qRT-PCR analysis of MMRN1 and SLC6A19 level in NCM-460 cells and different CRC cells. (B) qRT-PCR analysis of MMRN1 and SLC6A19 level in CRC tissues (n = 30) and adjacent-normal tissues (n = 30). (C) qRT-PCR analysis of MMRN1 and SLC6A19 level in RKO and HCT-116 cells transfected with si-NC or si-MMRN1 and si-SLC6A19. (D) CCK-8 assays were applied for evaluating cell viability. (E) Colony formation assays were applied for evaluating cell proliferation. (F) Transwell assays were performed to assess cell migration. (*P < 0.05; **P < 0.01; ***P < 0.001).

Similar articles

References

    1. Kastrinos, F., Kupfer, S. S. & Gupta, S. Colorectal cancer risk assessment and precision approaches to screening: Brave new world or worlds apart?. Gastroenterology164, 812–827 (2023). - PMC - PubMed
    1. Dekker, E., Tanis, P. J., Vleugels, J. L. A., Kasi, P. M. & Wallace, M. B. Colorectal cancer. Lancet394, 1467–1480 (2019). - PubMed
    1. Kotani, D. et al. Molecular residual disease and efficacy of adjuvant chemotherapy in patients with colorectal cancer. Nat. Med.29, 127–134 (2023). - PMC - PubMed
    1. Ciardiello, F. et al. Clinical management of metastatic colorectal cancer in the era of precision medicine. CA Cancer J. Clin.72, 372–401 (2022). - PubMed
    1. Shin, A. E., Giancotti, F. G. & Rustgi, A. K. Metastatic colorectal cancer: Mechanisms and emerging therapeutics. Trends Pharmacol. Sci.44, 222–236 (2023). - PMC - PubMed

Substances

LinkOut - more resources