. 2025 Aug;5(8):675-688.
doi: 10.1038/s43588-025-00832-7. Epub 2025 Jul 11.

Privacy-preserving multicenter differential protein abundance analysis with FedProt

Affiliations

Privacy-preserving multicenter differential protein abundance analysis with FedProt

Yuliya Burankova et al. Nat Comput Sci. 2025 Aug.

Abstract

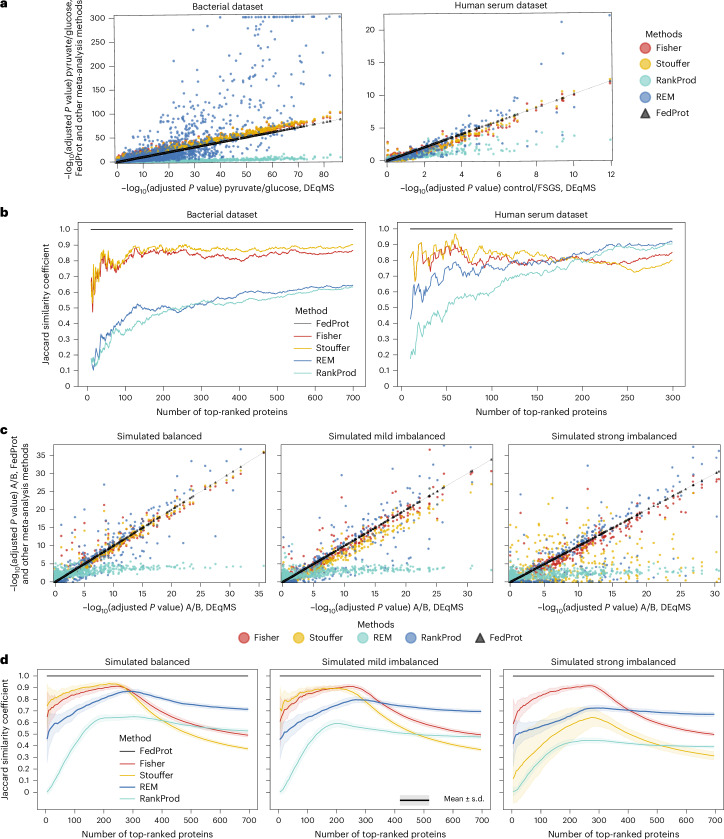
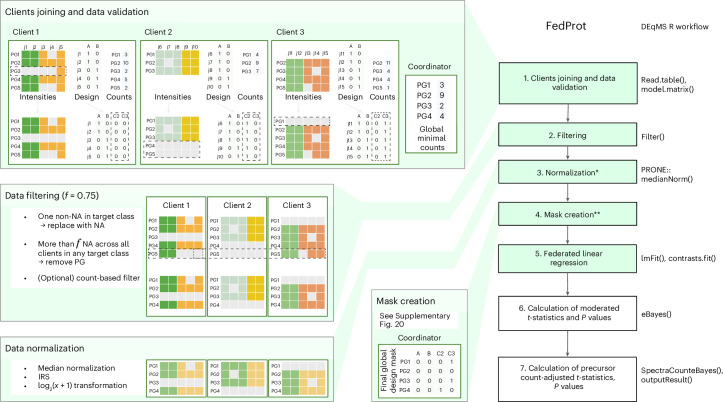
Quantitative mass spectrometry has revolutionized proteomics by enabling simultaneous quantification of thousands of proteins. Pooling patient-derived data from multiple institutions enhances statistical power but raises serious privacy concerns. Here we introduce FedProt, the first privacy-preserving tool for collaborative differential protein abundance analysis of distributed data, which utilizes federated learning and additive secret sharing. In the absence of a multicenter patient-derived dataset for evaluation, we created two: one at five centers from E. coli experiments and one at three centers from human serum. Evaluations using these datasets confirm that FedProt achieves accuracy equivalent to the DEqMS method applied to pooled data, with completely negligible absolute differences no greater than 4 × 10-12. By contrast, -log10P computed by the most accurate meta-analysis methods diverged from the centralized analysis results by up to 25-26.


Conflict of interest statement

Competing interests: B.K. is a co-founder and shareholder of MSAID; he holds no operational role in the company. The other authors declare no competing interests.

Figures

Fig. 1
Fig. 1. FedProt workflow overview.
a, Federated workflow overview. (1) Data preparation: data owners collect and preprocess MS data, obtain protein intensity and peptide count matrices, and define design matrices before participating as clients. Personal-level information (proteomics profiles) is contained in the client’s servers and are never shared (dashed lines around clients highlight different physical locations). (2) Federated learning: clients communicate with the central server (coordinator) to collaboratively train a global model without revealing their individual datasets, but through the exchange of local model parameters. The clients protect their local parameters using additive secret sharing (blue arrows). In case the data are not numeric, such as protein group names, they are sent to the coordinator without additive secret sharing (green arrows). The coordinator returns updated global parameters to clients (black arrows). (3) Result: after all federated computations, all clients receive the results mathematically equivalent to the results of centralized analysis of pooled dataset with DEqMS formatted as a table with abundance FCs, confidence intervals and adjusted P values. b, Overview of data communication using SMPC (additive secret sharing) inside FedProt. The clients protect their local parameters using additive secret sharing. Each client data point is masked with a noise mask. The noisy data and the noise masks are splitted into n encrypted parts (n > 2). These parts are exchanged among clients (blue arrows) via a relay server, ensuring that no single party receives more than one piece of the data from each of the other clients. After decrypting the received parts, clients sum the data, and send the reencrypted sums to the coordinator, who decrypts and aggregates the sums to compute the global result. For details, see Methods and Supplementary Methods. Created with BioRender.com.
Fig. 2
Fig. 2. Comparative analysis of adjusted P values and ranking consistency between centralized and decentralized methods for real and simulated datasets.
a,c, The comparison of negative log-transformed BH-method adjusted P values (−log10(adjusted P value)) computed by FedProt or meta-analysis methods (y axis) with the centralized DEqMS analysis (x axis), for bacterial and human serum datasets (a) and for simulated datasets (c), for one out of the 50 runs per scenario. The thin black line is the diagonal. b,d, The dependency of the Jaccard similarity coefficient on the number of top-ranked proteins identified by the centralized DEqMS and decentralized approaches, showing the results for the bacterial and human serum datasets (b) and for the simulated datasets (d). Proteins were ranked on the basis of their decreasing negative log-transformed BH-adjusted P values and not filtered by log2FC. The simulated data generation and the subsequent analysis were repeated 50 times, with aggregated results reported (mean values ± s.d.). Source data
Fig. 3
Fig. 3. Scheme of the FedProt workflow.
Steps that involve federated computations are shown in green. The corresponding stages of DEqMS workflow are shown on the right. Median normalization from the PRONE R package was used. The validation, filtering, normalization and design mask creation steps involving three clients (C1, C2 and C3) are shown on the left. PG denotes protein groups, j are sample numbers, and A and B are target classes compared during the analysis. On step 1, the PG3 value for sample j5 is replaced with NA (only one not-missing value in the client data). On step 2, the PG5 value for sample j5 is replaced with NA (one not-missing value for this PG in the target class for this client). After that, the whole PG5 group is removed from all clients because of too few nonmissing values (here, less than f = 0.75). On the design mask creation step, client 3 for PG1 is excluded because it has no data, same for PG4 of client 2; and, the client 3 became the new reference client and also excluded from computation (PG3 is missing in client 1). See Methods and Supplementary Methods for more details. *The normalization step is optional and could be turned off by the coordinator. In case of TMT data, for filtering out decoys, contaminant and reverse protein groups are required. The normalization by median across all centers and IRS inside each center can be performed during a FedProt run. **The step is for the federated approach only. Created with BioRender.com.

References

    1. Aebersold, R. & Mann, M. Mass-spectrometric exploration of proteome structure and function. Nature537, 347–355 (2016). - PubMed
    1. Altelaar, A. F. M., Munoz, J. & Heck, A. J. R. Next-generation proteomics: towards an integrative view of proteome dynamics. Nat. Rev. Genet.14, 35–48 (2013). - PubMed
    1. Muntel, J. et al. Surpassing 10000 identified and quantified proteins in a single run by optimizing current LC–MS instrumentation and data analysis strategy. Mol. Omics15, 348–360 (2019). - PubMed
    1. Bruderer, R. et al. Optimization of experimental parameters in data-independent mass spectrometry significantly increases depth and reproducibility of results. Mol. Cell. Proteom.16, 2296–2309 (2017). - PMC - PubMed
    1. Fröhlich, K. et al. Data-independent acquisition: a milestone and prospect in clinical mass spectrometry-based proteomics. Mol. Cell. Proteom.23, 100800 (2024). - PMC - PubMed

LinkOut - more resources