. 2025 Jul 11;16(1):1317.
doi: 10.1007/s12672-025-02873-w.

Hypoxia- and lactate metabolism-associated prognostic and therapeutic signature in pancreatic cancer

Affiliations

Hypoxia- and lactate metabolism-associated prognostic and therapeutic signature in pancreatic cancer

Chen-Hui Zhang et al. Discov Oncol. .

Abstract

Background: Hypoxia and lactate metabolism products are critical components of the tumor microenvironment in pancreatic cancer (PC), influencing tumor invasiveness, metastasis, and treatment resistance. This study aims to explore the role of hypoxia- and lactate metabolism-related genes (HLRGs) in predicting overall survival and guiding treatment for PC patients.

Methods: Gene expression and clinical data from PC patients were obtained from TCGA, ICGC, and GEO. Normal pancreatic tissue data were sourced from GTEx. Differential expression analysis was performed on the merged TCGA-PAAD and GTEx cohorts to identify differentially expressed genes (DEGs). We performed an intersection analysis between the DEGs and the HLRGs obtained from the MsigDB database to identify the DEGs associated with hypoxia and lactate metabolism in PC. A prognostic model was developed using random survival forests, Cox regression, and LASSO analysis in the TCGA-PAAD cohort. The model was externally validated in the ICGC-PACA and GSE85916 cohorts. Risk stratification was performed, and the differences between subgroups in tumor mutational burden, immune microenvironment, and drug response were analyzed. RT-qPCR validated the key genes expression differences.

Results: A prognostic model based on HLRGs (SLC7A7, PYGL, HS3ST1, DDIT4, CYP27A1, ANKZF1, COL5A1) was established. High-risk patients exhibited worse prognosis, higher tumor mutational burden, and better response to anti-PD-L1 therapy, while low-risk patients exhibited higher immune infiltration and increased chemotherapy sensitivity. RT-qPCR confirmed that SLC7A7 and COL5A1 were upregulated, while ANKZF1 was downregulated in PC.

Conclusions: We developed an HLRGs-based prognostic model that predicts overall survival and guides treatment strategies, contributing to precision therapy in PC.

Keywords: Drug sensitivity; Hypoxia; Lactate metabolism; Pancreatic cancer; Prognosis; Tumor immune microenvironment; Tumor mutational burden.


Conflict of interest statement

Declarations. Ethics approval and consent to participate: This study utilizes open-access databases and does not engage in original research involving human participants or animals. Competing interests: The authors declare no competing interests.

Figures

Fig. 1
Fig. 1
Flowchart of this study
Fig. 2
Fig. 2
Identification of differentially expressed genes related to hypoxia and lactate metabolism (HLR-DEGs) for pancreatic cancer. A Principal component analysis reveals significant gene expression differences between TCGA and GTEx cohort samples. B By obtaining genes common to hypoxia- and lactate metabolism-related genes and differentially expressed genes, the Venn diagram shows 124 HLR-DEGs. C Volcano plot of HLR-DEGs. Red represents genes that are relatively highly expressed in pancreatic cancer cell lines, while green represents the opposite. The 7 labeled genes are key genes for the prognostic model screened by machine learning and regression analysis in this study. D The heatmap shows the expression differences of HLR-DEGs between tumor tissues and normal tissues. The Control group contained 167 samples from the GTEx cohort and 4 peritumoral tissue samples from the TCGA cohort, and the Treatment group contained 171 tumor samples from the TCGA cohort
Fig. 3
Fig. 3
Protein-protein interaction network analysis and GO, KEGG enrichment analysis. A Protein-protein interaction network of hub gene in string database: protein interaction relationship. B GO enrichment analysis shows the top5 relevant pathways in Biological Process (BP), Cellular Component (CC), and Molecular Function (MF), respectively. C 20 significantly enriched KEGG pathways
Fig. 4
Fig. 4
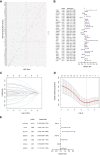
Identifying hub genes for constructing prognostic models. A Random Survival Forest algorithm selected 50 potential prognostic-related genes. B Univariate Cox regression analysis identified 34 genes associated with prognosis. CD Lasso regression analysis was employed to prevent overfitting of the model. E Multivariate Cox regression analysis ultimately identified 7 hub genes that could serve as independent prognostic factors
Fig. 5
Fig. 5
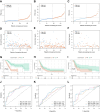
Construction and validation of prognostic models A Patients in TCGA-PAAD were stratified into high-risk and low-risk groups based on the median value of the risk score. D Scatterplot of the survival status of patients in the high-risk and low-risk groups. G KM survival curve to assess survival differences between patients in the high-risk and low-risk groups in the TCGA Cohort. J Accuracy of model predictions assessed by ROC curves in the TCGA cohort. B, E, H, K In the validation cohort of the ICGC-PADA, risk scores were calculated and patients were grouped using the prognostic modeling formulas, and survival status scatterplots, KM curves, and ROC curves were plotted. C, F, I, L Similarly, in the validation cohort of the GSE85916, scatter plot of survival status, KM survival curve, and ROC curves were plotted after grouping using the prognostic model
Fig. 6
Fig. 6
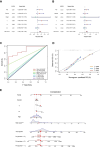
Prognostic correlation analysis combining clinical features and construction of nomgram. A Univariate Cox regression analysis results of clinical characteristics and risk score. B Multivariate Cox regression analysis results of clinical characteristics and risk score. C ROC curve of clinical characteristics and risk score. D Calibration curves assess nomgram prediction of patient mortality accuracy. E The Nomgram constructed by combining the riskscore and clinical characteristics predicts patient mortality at 1, 2, and 3 years. To illustrate the application of the nomogram, the sixth patient in the cohort (TCGA-HZ-8315-01) was randomly selected using the random number generation function in R, whose predictive information is exhibited
Fig. 7
Fig. 7
Tumor immune microenvironment analysis of TCGA cohort. A Analysis of the level of immune infiltration of 22 immune cell subtypes in the cohort based on the CIBERSORT algorithm. B ESTIMATE score to assess differences in immune infiltration between patients in the high-risk and low-risk groups. C Differences in the infiltration levels of 22 immune cell types between high-risk and low-risk patients. * P < 0.05, ** P < 0.01, *** < 0.001,**** < 0.0001. D Expression differences of immune checkpoint genes between high-risk and low-risk patients. *P < 0.05, **P < 0.01, ***P < 0.001. E The Circos plot illustrates the relationships among immune checkpoint genes. The thickness and color of the ribbons correspond to the degree of correlation between the expression levels of these genes. F-L Lollipop plots show the correlation between the seven hub genes of the prognostic model and 22 immune cell types
Fig. 8
Fig. 8
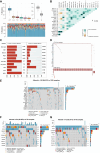
Tumor mutation burden (TMB) analysis of TCGA cohort. A Mutations in base sequences of samples. B Correlation heatmap between the 20 genes with the highest mutation frequencies. C Pathways enriched for mutant genes. D Genes with mutations in the RTK-RAS pathway and TP53 pathway in the TCGA cohort samples. The x-axis represents the cohort samples, and the y-axis represents the gene names. On the y-axis, blue indicates proto-oncogenes, while green indicates tumor suppressor genes. E Waterfall plots of the 20 genes with the highest mutation frequencies. F, G Waterfall plots of the 10 genes with the highest mutation frequencies in the low-risk and high-risk groups
Fig. 9
Fig. 9
Analysis of TMB and its correlation with prognostic model and immune infiltration. (A) The box plot shows the difference in tumor mutation burden between the high-risk group and the low-risk group. B The scatter plot shows the correlation between risk score and TMB. (C) KM survival curve of patients grouped by the median value of TMB. D KM survival curves of patients grouped by TMB combined with prognostic model risk stratification. E The scatter plot shows the correlation between TMB and CD8+ T cells. * P < 0.05, ** P < 0.01, *** P < 0.001. F The scatter plot shows the correlation between TMB and M0 macrophage. * P < 0.05
Fig. 10
Fig. 10
Prediction of drug response response in patients with pancreatic cancer. AI Differences in sensitivity to chemotherapeutic agents between patients in the high-risk group and those in the low-risk group based on GDSC database analysis. J Prediction of potentially sensitive drugs for pancreatic cancer patients based on the DGIdb database
Fig. 11
Fig. 11
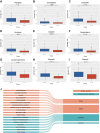
Further validation of key genes in the prognostic model AC The mRNA expression levels of SLC7A7,COL5A1 and ANKZF1 were relatively quantified by RT-qPCR (HPDE was used as the reference group and set to 1), and normalized with β-acton as the internal reference gene. * P < 0.05, ** P < 0.01, *** P < 0.001

References

    1. Stoffel EM, Brand RE, Goggins M. Pancreatic cancer: changing epidemiology and new approaches to risk assessment, early detection, and prevention. Gastroenterology. 2023;164(5):752–65. - PMC - PubMed
    1. Klein AP. Pancreatic cancer epidemiology: Understanding the role of lifestyle and inherited risk factors. Nat Reviews Gastroenterol Hepatol. 2021;18(7):493–502. - PMC - PubMed
    1. Qin C, Yang G, Yang J, Ren B, Wang H, Chen G et al. Metabolism of pancreatic cancer: paving the way to better anticancer strategies. Mol Cancer. 2020;19(1). - PMC - PubMed
    1. Liu Q, Li R, Wu H, Liang Z. A novel cuproptosis-related gene model predicts outcomes and treatment responses in pancreatic adenocarcinoma. BMC Cancer. 2023;23(1). - PMC - PubMed
    1. Kung-Chun Chiu D, Pui-Wah Tse A, Law C-T, Ming-Jing Xu I, Lee D, Chen M et al. Hypoxia regulates the mitochondrial activity of hepatocellular carcinoma cells through HIF/HEY1/PINK1 pathway. Cell Death Dis. 2019;10(12). - PMC - PubMed

LinkOut - more resources