. 2025 Jul 11;32(1):65.
doi: 10.1186/s12929-025-01157-3.

A novel β-TrCP1/NRF2 interaction inhibitor for effective anti-inflammatory therapy

Affiliations

A novel β-TrCP1/NRF2 interaction inhibitor for effective anti-inflammatory therapy

Ángel J García-Yagüe et al. J Biomed Sci. .

Abstract

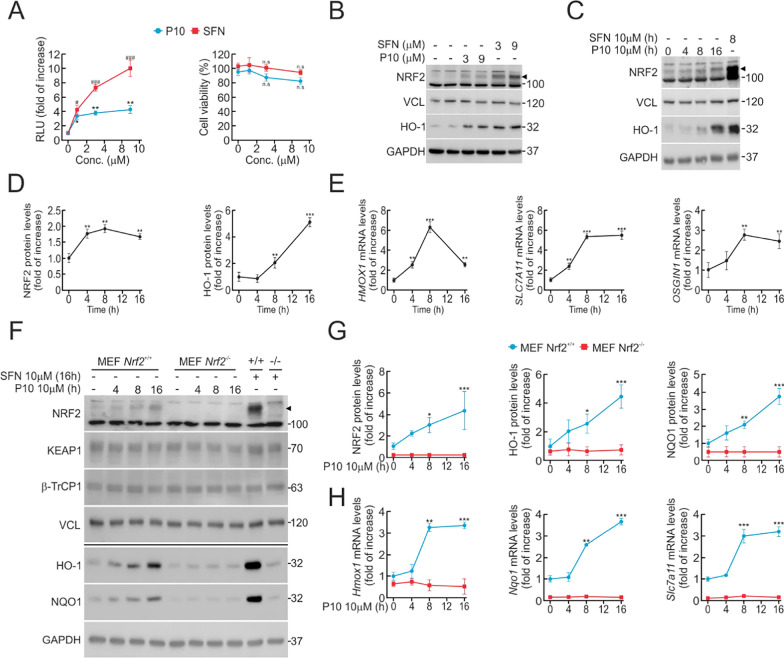
Background: Non-communicable chronic diseases are characterized by low-grade inflammation and oxidative stress. Extensive research has identified the transcription factor NRF2 as a potential therapeutic target. Current NRF2 activators, designed to inhibit its repressor KEAP1, often exhibit undesirable side effects. As an alternative approach, we previously developed PHAR, a protein-protein interaction inhibitor of β-TrCP1/NRF2, which promotes NRF2 activation. Using the same in silico screening platform, we have now identified a novel compound, P10. This small molecule selectively interferes with the β-TrCP1/NRF2 interaction, leading to NRF2 stabilization and transcriptional activation of its target genes in a β-TrCP1-dependent manner, demonstrating promising effects in a liver model of acute inflammation.

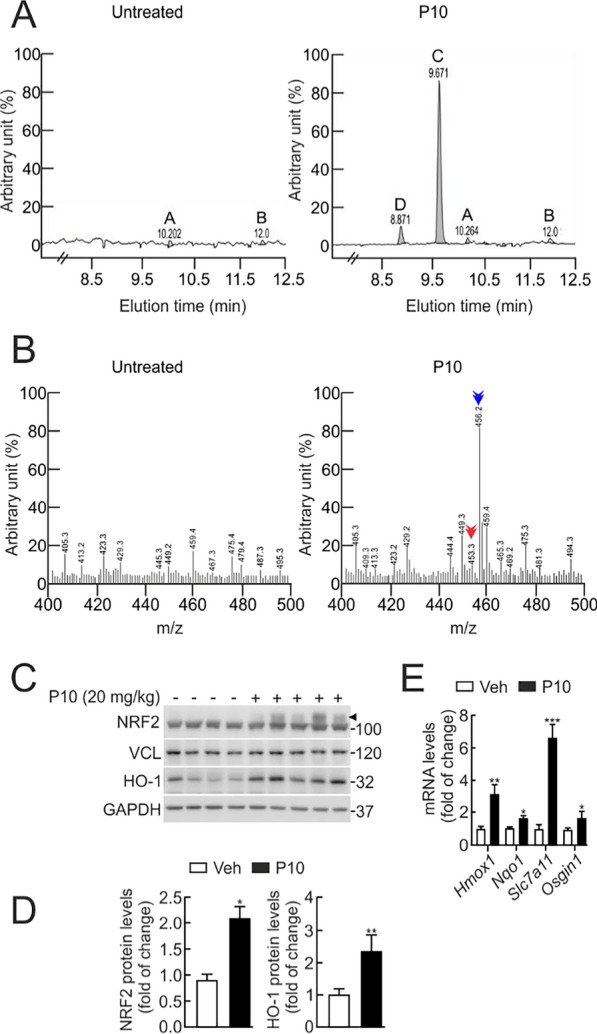
Methods: After an in silico screening of ∼1 million compounds, including molecular docking analysis, ADMET evaluation, and molecular dynamics simulations, we identified and characterized a novel small molecule, P10, which inhibits β-TrCP1/NRF2 interaction. The compound was validated using luciferase reporter assays, co-immunoprecipitation, and ubiquitination experiments. The specificity of P10 was assessed by comparing NRF2 signatures in wild-type and Nrf2-null cells. The impact of NRF2 activation induced by P10 was investigated by evaluating its antioxidant and anti-inflammatory responses against tert-butyl hydroperoxide and lipopolysaccharide, respectively. Finally, wild-type and Nrf2-null mice were administered P10 intraperitoneally at a dose of 20 mg/kg daily for five consecutive days. Four hours before sacrifice, all animals received a lipopolysaccharide (LPS) injection at 10 mg/kg.

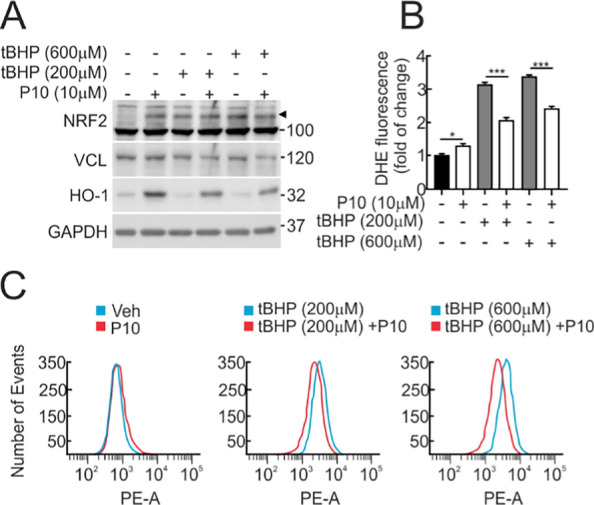
Results: P10 selectively disrupts the interaction between β-TrCP1 and NRF2, thereby inhibiting β-TrCP1-mediated ubiquitination of NRF2 and leading to the upregulation of NRF2 target genes. Additionally, P10 mitigates oxidative stress induced by tert-butyl hydroperoxide and reduces pro-inflammatory markers in an NRF2-dependent manner in macrophages treated with lipopolysaccharide. In a preclinical model of liver inflammation, P10 specifically targets the liver, significantly attenuating lipopolysaccharide-induced inflammation through the activation of NRF2. This is demonstrated by decreased expression of inflammatory cytokine genes and a reduction in F4/80-stained liver macrophages. Notably, this anti-inflammatory effect is absent in Nrf2-knockout mice, confirming its NRF2-dependent mechanism of action.

Conclusions: P10 emerges as a promising NRF2 activator by selectively disrupting the β-TrCP1/NRF2 interaction, highlighting its potential as a therapeutic agent for diseases presenting acute liver inflammation.

Keywords: Inflammation; Liver; NRF2; Protein–protein interaction-inhibitor; β-TrCP1.


Conflict of interest statement

Declarations. Ethics approval and consent to participate: Not applicable. Consent for publication: Not applicable. Competing interests: The authors declare no competing of interest. The funders had no role in the study's design; in the collection, analyses, or interpretation of data; in the writing of the manuscript, or in the decision to publish the results.

Figures

Fig. 1
Fig. 1
Selection of P10 as a candidate disruptor of the β-TrCP1-NRF2 interaction, based on molecular docking and dynamics simulations. A, B Structures of the cis and trans isomers of P10, respectively. C, D Low energy of P10 cis- and trans molecules docked to the surface of β-TrCP1, in the WD40 domain (PDB code 1P22). The ΔG values (calculated with YASARA software using Vina v1.2.5) are provided, where more negative values indicate stronger binding of P10 to the β-TrCP1 protein. E Molecular dynamics simulation of trajectories of the P10 isomers bound to β-TrCP1 during a 200 ns. F Calculated MM|PBSA free energy values for the P10-β-TrCP1 isomer complex. MM|PBSA calculations from YASARA yield positive values when strong and stable binding is predicted, whereas negative values suggest weak or no binding. G ΔG values were calculated for each snapshot generated during the 200 ns of MD simulation, with more negative values reflecting stronger binding of P10 to the protein. The frequency plot of the ΔG values for each simulation exhibits a Gaussian distribution. H ΔG values (mean ± S.D., calculated from the Gaussian fit) for each P10-protein complex. I Occupancy time of β-TrCP1 amino acids interacting with each P10 isomer over the 200 ns MD simulation
Fig. 2
Fig. 2
Evaluation of P10 as an NRF2 inducer. A MCF-7 c32ARE−LUC reporter cells were maintained under low-serum conditions (16 h, 1% FBS) and then subjected to the indicated P10 concentrations or 10 μM SFN, as a positive control. 0.1% DMSO was used as a vehicle. Luciferase activity was measured after 16 h of treatment. Data are mean ± S.D. (n = 4). *p < 0,05; **p < 0.01; #p < 0,05; ###p < 0.001 vs. vehicle according to a one-way ANOVA test. MTT assay, performed to determine the cell viability of P10 and SFN in low-serum starved (1% FBS) cells. Data are mean ± S.D. (n = 4). B MCF-7 c32ARE−LUC cells under low-serum conditions (16 h, 1% FBS) were subjected to the indicated P10 concentrations and SFN, as a positive control, for 16 h. Representative immunoblots of NRF2 (arrowhead) and HO-1, VCL, and GAPDH as a loading control. The NRF2 blot shows a strong unspecific band that is shown as an additional loading control. C Representative immunoblots of NRF2 (arrowhead) and HO-1, VCL, and GAPDH as a loading control from low-serum conditions (16 h, 1% FBS) MCF-7 c32ARE−LUC were submitted to 10 μM P10 for the indicated times, and SFN as a positive control. D Densitometric quantification of NRF2 and HO-1 protein levels from representative immunoblots of C expressed as a ratio of VCL and GAPDH, respectively. Data are mean ± S.D. (n = 3). **p < 0.01; ***p < 0.001 vs. vehicle according to a one-way ANOVA test. E Low-serum conditions (16 h, 1% FBS) MCF-7 c32ARE−LUC were subjected to 10 μM P10 for the indicated times. Transcript levels of HMOX1, SLC7A11, and OSGIN1 were determined by qRT-PCR and normalized by the geometric mean of GAPDH and VCL levels. Data are mean ± S.D. (n = 3). **p < 0.01 ***p < 0.001 according to a one-way ANOVA test. F Representative immunoblots of NRF2 (arrowhead), HO-1, NQO1, KEAP1, β-TrCP1, VCL, and GAPDH as a loading control from low-serum conditions (16 h, 1% FBS) MEFs from Nrf2-wildtype (Nrf2+/+) and Nrf2-knockout (Nrf2−/−) mice subjected to 10 μM P10 for the indicated times. G Densitometric quantification of NRF2, HO-1, and NQO1 protein levels from representative immunoblots from F, expressed as a ratio of VCL and GAPDH, respectively. Data are mean ± S.D. (n = 3). *p < 0,5; **p < 0,01; ***p < 0.001 vs vehicle of Nrf2+/+ according to a two-way ANOVA test. H mRNA levels of several ARE-genes were determined after 10 μM P10 for the indicated times, by qRT-PCR and normalized by the geometric mean of Gapdh and Vcl levels. Data are mean ± S.D. (n = 3). **p < 0,01; ***p < 0.001 vs Nrf2+/+ according to a two-way ANOVA test
Fig. 3
Fig. 3
P10 induces NRF2 signature in a KEAP1-independent but PI3K/AKT/GSK3β-dependent manner. A Representative immunoblots of NRF2 (arrowhead), HO-1, β-TrCP1, KEAP1, VCL, and GAPDH as a loading control from low-serum conditions (16 h, 1% FBS) MEFs from Keap1-wildtype (Keap1+/+) and Keap1-knockout (Keap1−/−) mice subjected to 10 μM P10 for the indicated times, and 10 μM SFN and 10 μM PHAR, as a positive control. B Densitometric quantification of NRF2 and HO-1 protein levels from representative immunoblots from A, expressed as a ratio of VCL and GAPDH, respectively. Data are mean ± S.D. (n = 3). *p < 0.05; **p < 0.01; ***p < 0.001; #p < 0,05 vs point 0 according to a two-way ANOVA test. C mRNA levels of ARE-genes were determined after 10 μM P10 for the indicated times, by qRT-PCR and normalized by the geometric mean of Gapdh and Vcl levels. Data are mean ± S.D. (n = 3). *p < 0.05; **p < 0.01; ***p < 0.001; #p < 0,05; ###p < 0.001 vs point 0 according to a two-way ANOVA test. D Representative immunoblots of NRF2, AKT-pSer473, AKT, GSK-3β-pSer9, GSK-3β, KEAP1, β-TrCP1, and VCL as a loading control. Low-serum conditions (16 h, 1% FBS) Keap1−/− MEFs were subjected to the vehicle (0.1% DMSO) or 10 μM of P10 for 16 h. Then, cells were treated with 20 μM LY294002 for the indicated times. E Densitometric quantification of NRF2 protein levels from representative immunoblots from D, expressed as a ratio of VCL. Data are mean ± S.D. (n = 3). *p < 0.05 vs LY2940002 at point 0, according to a two-way ANOVA test. F Representative immunoblots of NRF2 (arrowhead), KEAP1, β-TrCP1, VCL, and GAPDH as a loading control. Keap1−/− MEFs were low-serum conditions (16 h, 1% FBS) and then subjected to 10 µM P10, 10 µM SB216763 (GSK-3 inhibitory agent), or to both treatments for 8 h. G Densitometric quantification of NRF2 protein levels from representative immunoblots from F, expressed as a ratio of GAPDH and VCL. Data are mean ± S.D. (n = 3) *p < 0.05; **p < 0.01; ***p < 0.001 according to Student t-test
Fig. 4
Fig. 4
P10 increases NRF2 protein levels in a β-TrCP1-dependent-manner. A Representative immunoblots from control (shCTRL) and β-TrCP knocked-down (shβ-TrCP1/2) MEFs that were submitted to 10 μM P10 for the indicated times, including the following proteins: NRF2 (bracket), HO-1, β-CATENIN, KEAP1, β-TrCP1, and VCL and GAPDH as a loading control. B Densitometric quantification of NRF2 and β-CATENIN protein levels from representative immunoblots from A, normalized with GAPDH and VCL. Data are mean ± S.D. (n = 3). *p < 0,05; **p < 0.01 vs. shCTRL at point 0 according to a one-way ANOVA test. C Expression of three NRF2-regulated genes in shCTRL vs. shβ-TrCP1/2 Keap1−/− MEFs. Cells were submitted to 10 μM P10 for the indicated times, and transcript levels were determined by qRT-PCR and normalized by the geometric mean of Gapdh and Vcl levels. Data are mean ± S.D. (n = 3). **p < 0.01; ***p < 0.001 vs. shCTRL at point 0 according to a two-way ANOVA test. D Knockdown of Btrc (encoding β-TrCP1) and Fbxw11 (encoding β-TrCP2). Keap1−/− MEFs were transduced with control lentivirus encoding shCTRL or a combination of two lentiviruses encoding sh-Btrc and sh-Fbxw11. After 5 days, transcript levels of Btrc and Fbxw11 were determined by qRT-PCR and normalized by the geometric mean of Gapdh and Vcl. Data are mean ± S.D. (n = 3). ***p < 0.001 vs. shCTRL according to a Student's t-test. E MCF-7 c32ARE−LUC cells were cotransfected with the indicated plasmids or with an empty vector. After transfection (5 h), cells were in low-serum conditions (16 h, 1% FBS) and subjected to 10 µM P10. One-fifth of the whole-protein lysate was used to control for protein expression, and it was blotted with V5, FLAG, and VCL. The rest of the protein lysates were immunoprecipitated with anti-FLAG antibodies and immunoblotted with anti-FLAG and anti-V5. F MCF-7 c32ARE−LUC cells were transfected with the indicated plasmids. After transfection (5 h), cells were in low-serum conditions (16 h, 1% FBS) and subjected to P10 for the indicated concentrations. An affinity-purified His-tagged fraction (His-Pull-down) was blotted with an anti-HA antibody, and a whole-cell lysate (input) was blotted with V5, FLAG, and VCL as loading control. As controls of ubiquitin bound to NRF2, we carried out one with just co-transfected NRF2ΔETGE-V5/6xHis with Flag-β-TrCP1 without HA-Ub for validating the recognition of specific HA antibody smear-band, and an additional control employed just HA-Ub transfected for evaluating unspecific HA-Ub binding to Probond beads
Fig. 5
Fig. 5
P10 attenuates redox dysregulation. A Representative immunoblots of NRF2 (arrowhead), HO-1, VCL, and GAPDH as a loading control from low-serum conditions (16 h, 1% FBS) MCF-7 c32ARE−LUC that were pre-treated with 10 μM P10 for 16 h and then submitted to tert-butyl hydroperoxide (tBHP) as indicated for 3 h. B, C Flow cytometry analysis of tert-butyl hydroperoxide-induced intracellular ROS production measured by 2 μM hydroethydine (HE) fluorescent probe (BP 575/24 nm). A representative sample of 10,000 cells is shown for each condition. Data are mean ± S.D. (n = 3). *p < 0.05; ***p < 0.001 vs. P10 according to a Student's t-test
Fig. 6
Fig. 6
P10 decreases the inflammatory response in an NRF2-dependent manner. Low-serum conditions (16 h, 1% FBS) peritoneal macrophages were pre-treated with 10 µM P10 for 16 h and then incubated with 50 ng/ml LPS for 3 h. A Representative immunoblots of NRF2 (arrowhead), HO-1, COX-2, pre-IL-1β, GAPDH, and VCL as a loading control. B Densitometric analysis of NRF2, HO-1, COX-2, and pre-IL-1β protein levels from representative immunoblots from A, normalized with GAPDH or VCL. Data are mean ± S.D. (n = 3). *p < 0.05; **p < 0,01; ***p < 0,001 vs. vehicle or LPS treatment, ##p < 0,01; ###p < 0.001 according to the comparison bar, as indicated, according to a one-way ANOVA test. C Transcript levels of Il1b, Ptgs2, Inos, Il6, and Tnf were determined by qRT-PCR and normalized by the average of Gapdh and Vcl. Data are mean ± S.D. (n = 3). *p < 0.05; **p < 0,01; ***p < 0.001 vs. vehicle or LPS treatment; ##p < 0,01; ###p < 0.001 according to the comparison bar, as indicated according to a one-way ANOVA test
Fig. 7
Fig. 7
P10 activates NRF2 in the liver. C57Bl/6 male mice received one intraperitoneal (i.p.) injection of 20 mg/kg P10 daily for 5 days, and their livers were analyzed 2 h after the last treatment. A Analysis by HPLC–UV of liver extracts comparing vehicle (Tween-80 + PBS, 1:7) vs. P10-treated mice (Tween-80 + PBS, 1:7). B Left graph, analysis by HPLC–MS liver vehicle elution. Right graph, analysis by HPLC–MS of peak C detected in the liver of P10-treated mice. Peak D could be a product metabolism of P10 from the liver. Note that the identification of a 456 Da molecule (blue arrow) and a 453 Da (red arrow) in liver P10-treated does not appear in liver-vehicle elution, corresponding to the P10 molecular weight. C Representative immunoblots of NRF2 (arrowhead), HO-1 and GAPDH, and VCL as a loading control from liver extracts of each mouse from the vehicle and P10-treated mice i.p. with 20 mg/kg. D Densitometric quantification of NRF2 and HO-1 levels from C normalized with GAPDH or VCL. Data are mean ± S.D. (n = 3). *p < 0.05; **p < 0.01 vs. vehicle according to a Student’s t-test. E mRNA levels of ARE-genes were determined from liver extracts of the vehicle and P10-treated mice, by qRT-PCR and normalized by the geometric mean of Gapdh and Vcl levels. Data are mean ± S.D. (n = 3). *p < 0.05; **p < 0.01; ***p < 0.001 vs vehicle according to a Student's t-test
Fig. 8
Fig. 8
P10 lessens the inflammatory-liver response in the NRF2-dependent context in mice treated with LPS. C57Bl/6 male mice were treated i.p with vehicle (Tween-80 + PBS, 1:7) or 20 mg/kg P10 for 5 days. Two hours after the last administration, mice received vehicle or 10 mg/kg LPS and were sacrificed after 4 h for liver analysis. A Representative immunoblots in liver extracts of NRF2 (arrowhead), HO-1, pre-IL-1β, GAPDH, and VCL as a loading control. B Densitometric quantification of the NRF2, HO-1, and pre-IL-1β protein levels from representative immunoblots shown in A, expressed as a ratio of protein/GAPDH or protein/VCL. Data are mean ± S.D. (n = 5) **p < 0.01, ***p < 0.001 vs. vehicle and ##p < 0.01 vs. LPS according to a Student's t-test. C mRNA levels of Il1b, Inos, Tnf, and Ptgs2 were determined by qRT-PCR and normalized by the geometric mean of Gapdh and Vcl levels. Data are mean ± S.D. (n = 5). **p < 0.01, ***p < 0.001 vs. vehicle and ##p < 0.01, ###p < 0.001 vs. LPS according to a Student's t-test. D Paraffin-embedded liver section stained with H&E and immunohistochemistry for F4/80. E Quantification of the DAB-staining positive area of F4/80. Data are mean ± S.D. (n = 5). ***p < 0.001 vs LPS according to a Student's t-test

References

    1. Taguchi K, Motohashi H, Yamamoto M. Molecular mechanisms of the Keap1-Nrf2 pathway in stress response and cancer evolution. Genes Cells. 2011;16(2):123–40. - PubMed
    1. Rojo AI, Buttari B, Cadenas S, Carlos AR, Cuadrado A, Falcao AS, et al. Model organisms for investigating the functional involvement of NRF2 in non-communicable diseases. Redox Biol. 2025;79: 103464. - PMC - PubMed
    1. Kensler TW, Wakabayashi N, Biswal S. Cell survival responses to environmental stresses via the Keap1-Nrf2-ARE pathway. Annu Rev Pharmacol Toxicol. 2007;47:89–116. - PubMed
    1. Hayes JD, Dinkova-Kostova AT. The Nrf2 regulatory network provides an interface between redox and intermediary metabolism. Trends Biochem Sci. 2014;39(4):199–218. - PubMed
    1. Harvey CJ, Thimmulappa RK, Sethi S, Kong X, Yarmus L, Brown RH, et al. Targeting Nrf2 signaling improves bacterial clearance by alveolar macrophages in patients with COPD and in a mouse model. Sci Transl Med. 2011;3(78):78ra32. - PMC - PubMed

MeSH terms

Substances

LinkOut - more resources