. 2025 Jul 11;44(1):199.
doi: 10.1186/s13046-025-03439-y.

PARP9-PARP13-PARP14 axis tunes colorectal cancer response to radiotherapy

Affiliations

PARP9-PARP13-PARP14 axis tunes colorectal cancer response to radiotherapy

Rimvile Prokarenkaite et al. J Exp Clin Cancer Res. .

Abstract

Background: Colorectal cancer (CRC) is the third most prevalent cancer worldwide. Despite substantial advancements in CRC therapy in recent years, ionizing radiation (IR) continues to be the predominant treatment for colon malignances. However, it still lacks the precision required for excellent therapeutic outcomes, ultimately resulting in tumor radioresistance. This study seeks to explore the potential of atypical PARPs including PARP9, PARP12, PARP13 and PARP14 as innovative radiosensitizing targets for CRC.

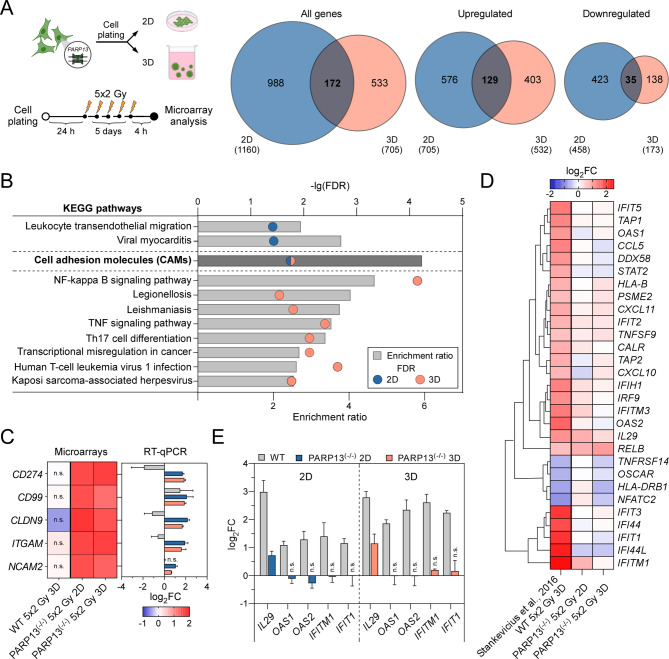
Methods: We utilized CRISPR/Cas9-mediated gene editing to knockout the PARP9, PARP12, PARP13 and PARP14 in HT29 and DLD1 cells. The cells were exposed to either a single dose of 6-10 Gy or to fractionated dose of 5 × 2 Gy X-ray radiation cultivating cells in 2D, laminin-rich ECM 3D and multicellular spheroid models. The transcriptomes of nonirradiated and irradiated cells were analyzed using microarrays. Gene set enrichment analysis was conducted to determine the pathways in which PARP13 is engaged. Cell viability was assessed using a clonogenic assay. Gene expression levels in cells and patient samples were quantified using RT-qPCR.

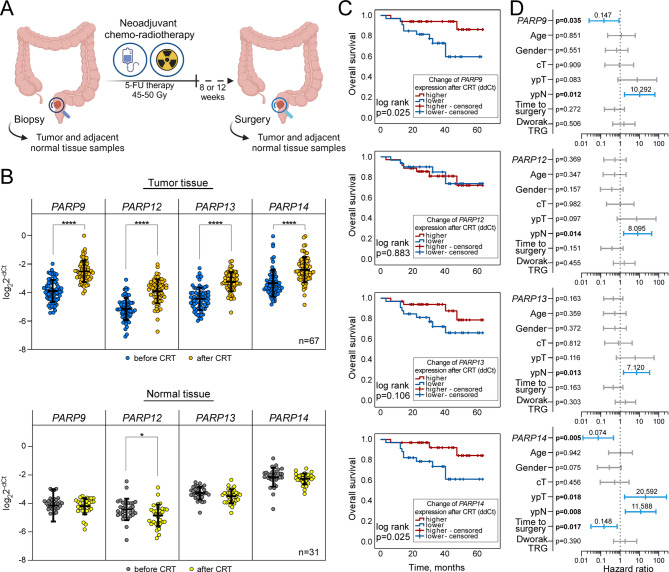
Results: The expression of PARP9, PARP12, PARP13 and PARP14 was particularly elevated in irradiated colorectal cancer HT29 cells in a microenvironment-dependent manner. PARP13 deficiency significantly enhanced the sensitivity of HT29 cells to both single-dose and multifractionated irradiation regimens, resulting in reduced colony formation and spheroidal integrity. Microarray analysis indicated that PARP13 may modulate the expression genes associated with immune response signaling pathways, including members of PARP family. Furthermore, PARP13 loss in HT29 cells markedly impaired the expression of immune response related genes following multifractionated ionizing irradiation. Finally, chemoradiotherapy significantly elevated the expression of PARP9, PARP12, PARP13 and PARP14 in rectal tumors, while having no effect on adjacent normal colon tissues. Elevated pre-treatment PARP9 expression levels and a blunted post-treatment increase in PARP9 and PARP14 expression predicted poor overall survival in rectal cancer patients, while PARP13 emerged as the most significant discriminator between tumor and healthy tissue.

Conclusions: Collectively, the PARP9/13/14 axis is implicated in the response of CRC to radiation treatment in both preclinical and clinical settings, demonstrating the atypical members of the PARP family as attractive targets for neoadjuvant radiotherapy.

Keywords: PARP13; PARP14; PARP9; 3D cell culture; Interferon stimulated genes; Radiosensitizers; Radiotherapy.


Conflict of interest statement

Declarations. Ethics approval and consent to participate: The study was approved by the Ethics Committee of Vilnius Region Biomedical Research (2017-07-04; No. of permission 158200-17-930-433) and informed consent was obtained from all participants. All clinical procedures were conducted at the National Cancer Institute in Lithuania between 2017 and 2022 according to Helsinki regulation. Consent for publication: Not applicable. Competing interests: The authors declare no competing interests.

Figures

Fig. 1
Fig. 1
Ionizing radiation induces PARP gene expression in colorectal cancer cells in a microenvironment dependent manner. (A) Heatmap analysis depicts the expression pattern of PARP family genes in laminin-enriched 3D cell cultures of DLD1 and HT29 cells following multifractionated (5 × 2 Gy) dose ionizing radiation treatment. Unirradiated cells were used as a control. The microarray dataset originates from a previous study (GSE75551). (B) Multifractionated irradiation experimental design. 24 h after cell plating, cells were irradiated with a single dose of X-ray (2 Gy) every 24 h for 5 days, resulting in a total dose of 10 Gy. RNA for gene expression analysis was extracted 4 h after cell irradiation. Below are schematics and representative phase-contrast images of CRC cells grown under three different plating conditions: monolayer culture (2D), three-dimensional laminin rich-extracellular matrix culture (lr-ECM 3D), and multicellular spheroid (MCS) system. Scale bars indicate 200 μm. (C) Expression of PARP9,12,13,14 genes was examined using RT-qPCR in colorectal cancer cells (DLD1, HT29) cultivated under 2D or both 3D cell culture conditions after exposure to multifractionated irradiation (5 × 2 Gy). (D) Similarly, the expression of PARP9,12,13,14 was investigated in normal colon cells (CRL1790) grown in a monolayer or lr-ECM coated 2D culture, following the same regimen of irradiation (5 × 2 Gy). Results show means with error bars representing standard deviation (n = 3, *p < 0.05, Student’s t-test)
Fig. 2
Fig. 2
PARPs regulate colorectal cancer cell radiosensitivity in a microenvironment-dependent manner. (A) DLD1 and HT29 cell sublines with indicated PARP knockouts were generated using CRISPR/Cas9 genome editing. Single dose and multifractionated irradiation experimental design for colony formation assay (1) and MCS growth assay (2). (B) Clonogenic survival of CRC PARP knockout cells after irradiation with a single dose (6 Gy) or multifractionated (5 × 2 Gy) regimens. Wild type cells were used as the control. Results show means with error bars representing standard deviation (n = 3, *p < 0.05, **p < 0.01, ***p < 0.001, Student’s t-test). (C) Morphology of CRC PARP knockout cells spheroids, (D) their growth kinetics and viability following multifractionated irradiation treatment. Representative images show the spheroids grown at the optimal seeding densities between day 0 and 6 of irradiation treatment. Scale bars indicate 200 μm. The growth kinetics are represented by spheroid diameter on the 6th day of irradiation treatment; same time point for MCS viability. Unirradiated spheroids were used as the control. Results show means with error bars representing standard deviation (n = 3, *p < 0.05, **p < 0.01, ***p < 0.001, during statistical evaluation, two-way ANOVA for MCS diameter, Student’s t-test for MCS viability)
Fig. 3
Fig. 3
PARP13 regulates immune gene expression in CRC cells. (A) Experimental design of microarray analysis. Total RNA was extracted 48 h after plating HT29 wild type and PARP13 knockout cells in 2D (blue) or lr-ECM 3D (yellow) culture conditions. Venn diagrams illustrate differentially expressed genes (DEGs) in HT29 PARP13 knockout cells compared to wild type cells, determined using Agilent array analysis of total mRNA (n = 3 independent experiments). (B) KEGG pathways significantly enriched in HT29 PARP13 knockout cells grown under 2D and lr-ECM 3D conditions. Shared pathways commonly enriched in both cell culture conditions are highlighted in bold. The upper X-axis represents -lgFDR values, the lower X-axis indicates the number of genes in each pathway. The Y-axis shows the enriched KEGG pathways. (C) KEGG pathway enrichment analysis of overlapped genes between 2D and lr-ECM 3D systems, encompassing both upregulated and downregulated genes. The Y-axis represents significantly enriched KEGG pathways, the X-axis displays the enrichment ratio, and the color of the dots signifies -lgFDR values. The size of the dots corresponds to the number of genes enriched in the respective KEGG pathways. (D) Comparative Venn’s diagram analysis showing amount of DEGs in comparison to an independent PARP13 knockout experiment in HeLa cell line (GSE56667). The box emphasizes genes commonly expressed among all three groups. (E) Microarray data validation using RT-qPCR analysis. Bars indicate fold change of representative upregulated genes belonging to three distinct groups: PARP family, apoptosis, and immune response in HT29 PARP13 knockout cells compared to wild type cells. The results display means with error bars representing standard deviation (n = 3, p < 0.05, Student’s t-test)
Fig. 4
Fig. 4
PARP13 regulates immune gene expression in ionizing radiation treated CRC cells. (A) Experimental design of microarray analysis for multifractionated irradiation treated HT29 PARP13 knockouts in both 2D and lr-ECM enriched 3D conditions. Cells were irradiated with a single dose of X-ray (2 Gy) every 24 h for 5 days, resulting in a total dose of 10 Gy. Total RNA was extracted 4 h post cellular irradiation. Venn diagrams illustrate differentially expressed genes (DEGs) in 2D (blue) and lr-ECM 3D (pink) conditions from global analysis in irradiated HT29 PARP13 knockouts relative to non-treated PARP13 knockout cells, determined using Agilent array analysis of total mRNA (n = 3 independent experiments). (B) Significantly enriched KEGG pathways in irradiated PARP13 knockout cells grown under 2D and lr-ECM 3D conditions. The upper X-axis represents -lgFDR values, the lower X-axis indicates the enrichment ratio, and the Y-axis shows the enriched KEGG pathways. (C) Microarray data validation using RT-qPCR analysis. Results are presented as means with error bars representing standard deviation (n = 3, Student’s t-test, n.s.– not significant). (D) Clustering heatmap of immune response related gene expression data in irradiated HT29 wild type (GSE75551) and PARP13 knockout cells under 2D or lr-ECM enriched 3D conditions. (E) Confirmation of differential expression of selected four immune response-related genes in HT29 wild type and PARP13 knockout irradiated cells using RT-qPCR. Results demonstrate means (n = 3, Student’s t-test, n.s.– not significant)
Fig. 5
Fig. 5
Association of PARP9,12,13,14 gene expression with rectal cancer clinical outcome following chemoradiotherapy (CRT) treatment. (A) Schematic overview of sample collection from rectal cancer patients. Tumor and adjacent normal tissue samples were obtained through biopsies patients with suspected rectal cancer. Following confirmation of diagnosis, patients underwent neoadjuvant chemoradiotherapy involving 5-fluorouracil before surgical resection of tumor. During the tumor resection surgery, additional samples of tumor and adjacent normal tissue were collected from each patient for further analysis. (B) qRT-PCR analysis of relative PARP gene expression levels before and after CRT in tumor and normal tissue sample groups. The cycle threshold (Ct) values of target genes were normalized to GAPDH, ACT and TBP levels. Lines within boxes indicate relative gene expression mean values, while whiskers denote standard deviation of the relative gene expression values (tumor n = 67, normal n = 31, Student’s t test, *p < 0.05 and ****p < 0.0001). (C) Kaplan-Meier survival curves demonstrating the association between changes in PARP expression after CRT and overall survival (OS) in rectal cancer tissue samples (n = 67). Patients were stratified into high and low change of expression groups according to the mean value. Curves were compared using the log-rank test, p values shown. (D) Prognostic performance of PARP genes expression changes and clinicopathologic features by multivariate Cox regression analysis. Forest plot illustrates the hazard ratio (vertical bar and number above it), and 95% confidence intervals (whiskers) associated with predictors for rectal cancer patients’ OS in tumor samples (n = 67). Significant predictors are highlighted in blue, with displayed p values

References

    1. Ferlay J, Ervik M, Lam F, Laversanne M, Colombet M, Mery L et al. Global Cancer Observatory: Cancer Today. 2024. Cancer today. Available from: https://gco.iarc.who.int/today/
    1. Xi Y, Xu P. Global colorectal cancer burden in 2020 and projections to 2040. Translational Oncol. 2021;14(10):101174. - PMC - PubMed
    1. Lievens Y, Borras JM, Grau C. Provision and use of radiotherapy in Europe. Mol Oncol. 2020;14(7):1461–9. - PMC - PubMed
    1. Roos WP, Kaina B. DNA damage-induced cell death: from specific DNA lesions to the DNA damage response and apoptosis. Cancer Lett. 2013;332(2):237–48. - PubMed
    1. Huang RX, Zhou PK. DNA damage response signaling pathways and targets for radiotherapy sensitization in cancer. Sig Transduct Target Ther. 2020;5(1):1–27. - PMC - PubMed

MeSH terms

Substances

LinkOut - more resources