

Trend of malaria parasites infection in Ethiopia along an international border: a Bayesian spatio-temporal study
- PMID: 40646656
- PMCID: PMC12247342
- DOI: 10.1186/s40249-025-01320-w
Trend of malaria parasites infection in Ethiopia along an international border: a Bayesian spatio-temporal study
Abstract
Background: Malaria is a major worldwide health concern that impacts many individuals worldwide. P. falciparum is Africa's main malaria cause. However, P. vivax share a large number in Ethiopia than any other countries in Africa, followed by the closest countries. This research aims to examine the spatiotemporal trends in the risk of malaria caused by P. falciparum and P. vivax in Ethiopia and other countries that share borders between 2011 and 2020.
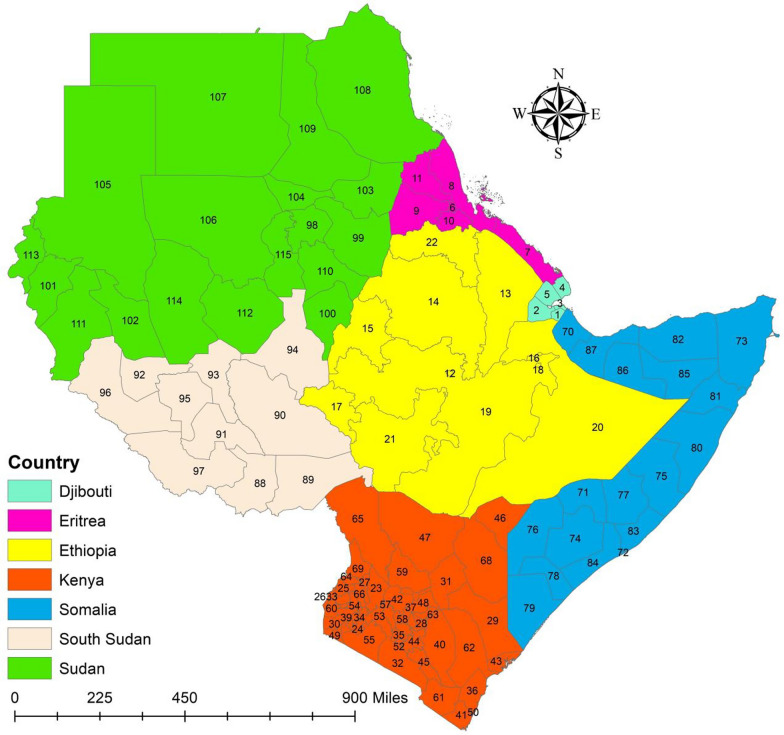
Methods: This study was carried-out in seven East African countries in 115 administration level 1 (region) settings. We used secondary data on two plasmodium parasites, P. falciparum, and P. vivax, between 2011 and 2020 from the Malaria Atlas Project. This study used a Bayesian setup with an integrated nested Laplace approximation to adopt spatiotemporal models.
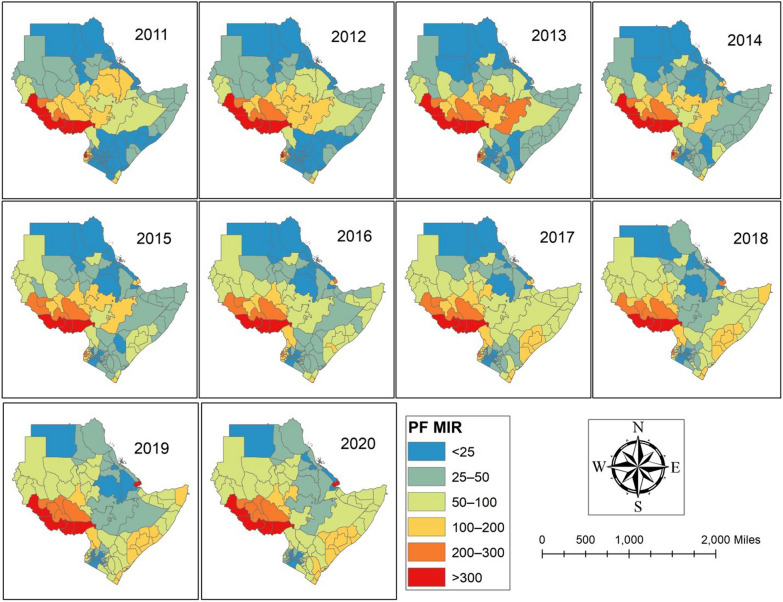
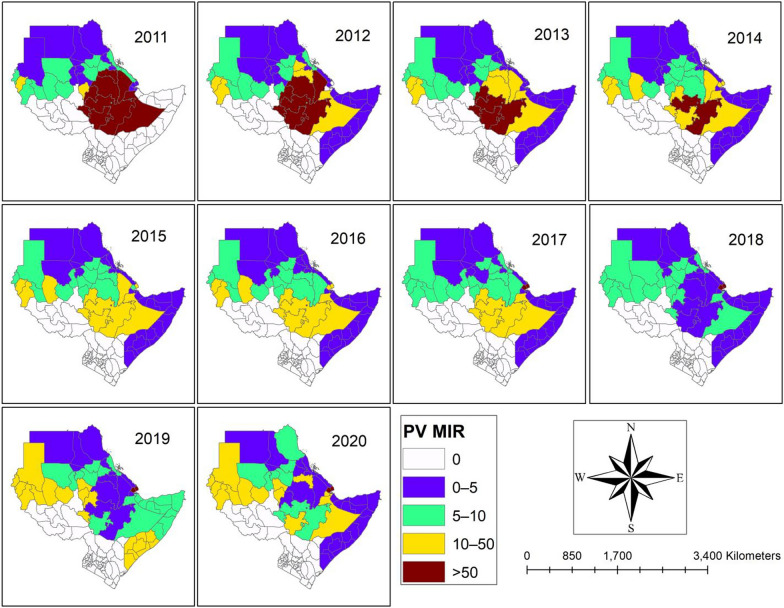
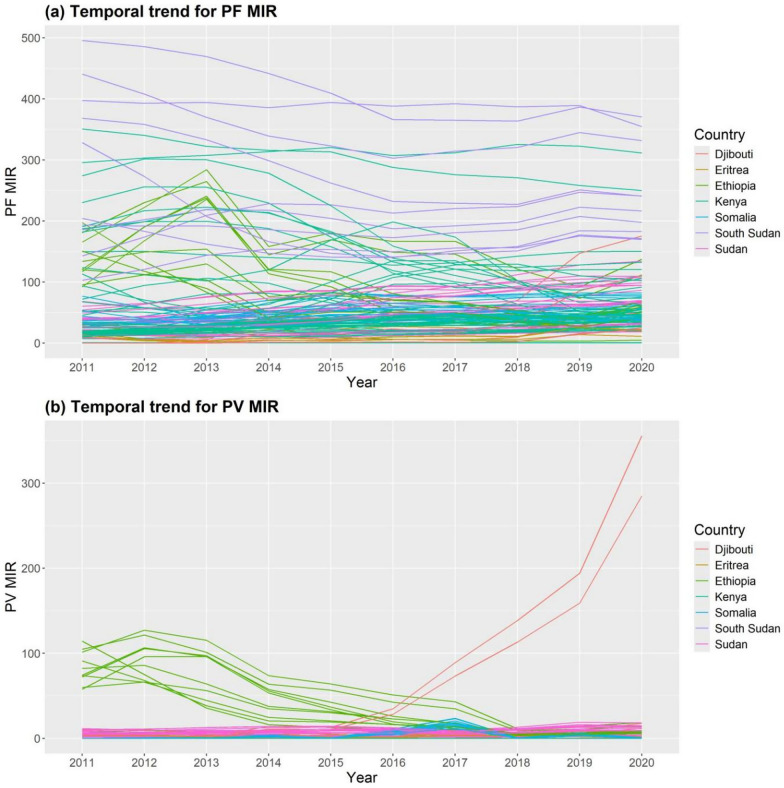
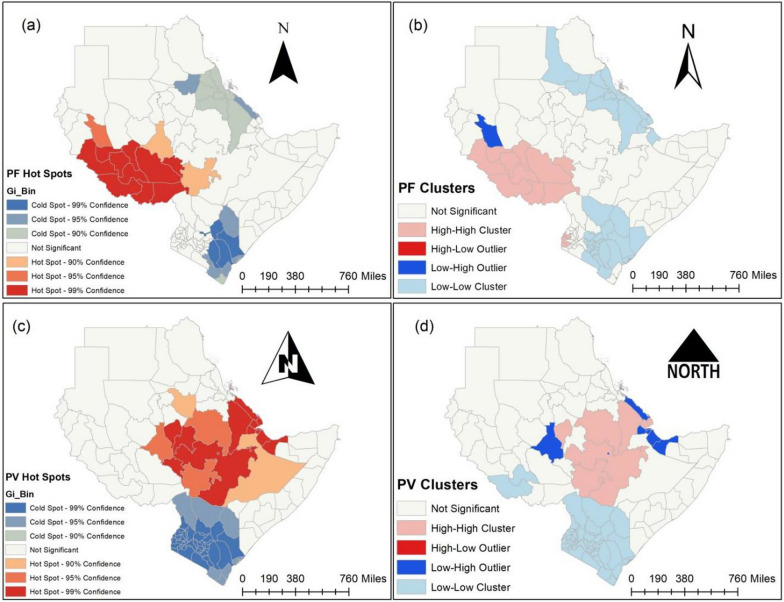
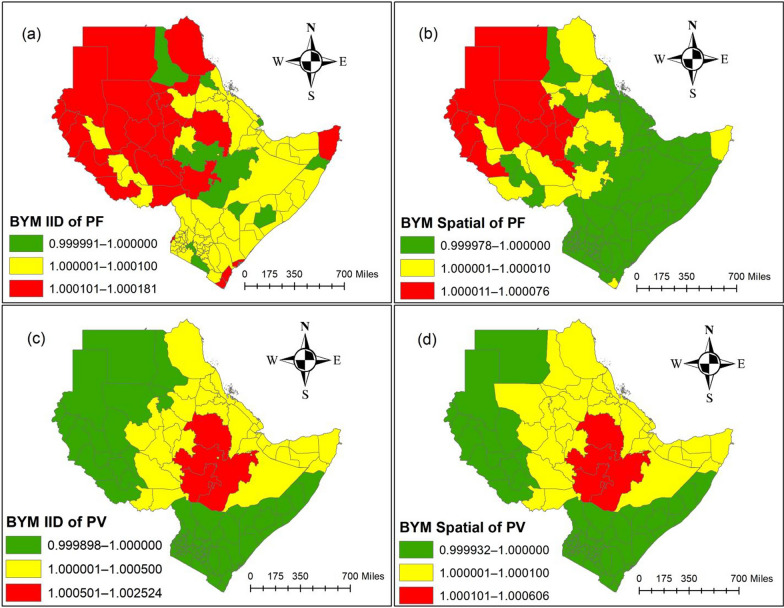
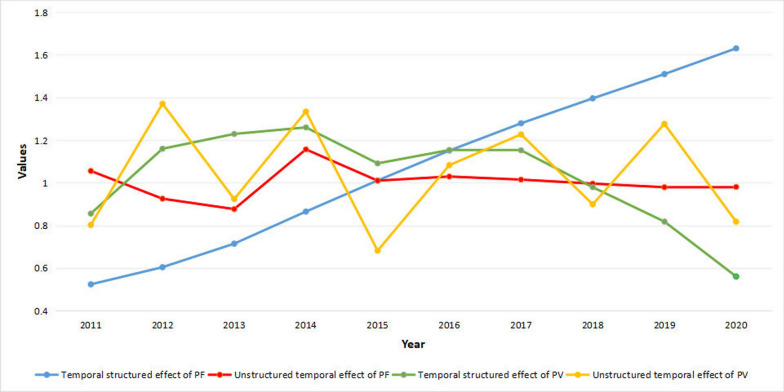
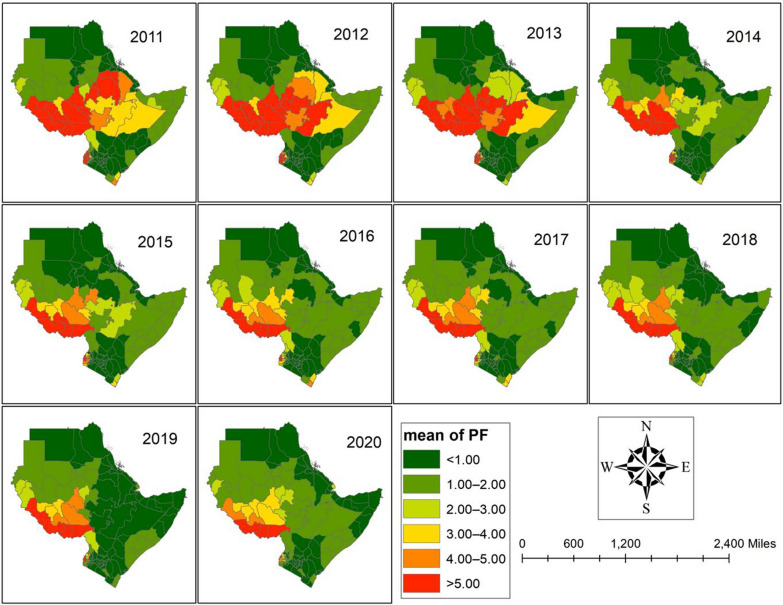
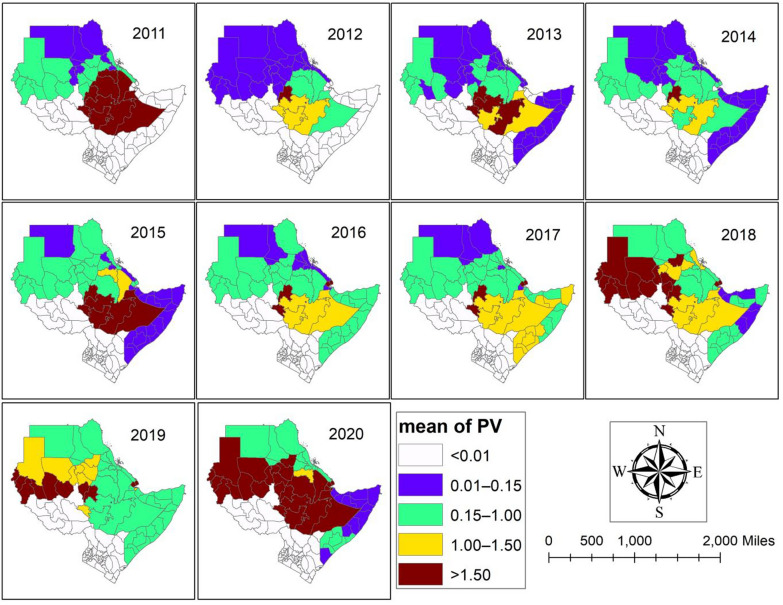
Results: We analyzed P. falciparum and P. vivax malaria incidence data from 2011 to 2020 in 115 regions. Between 2011 and 2020, all of South Sudan's areas, Ethiopia's Gambella region, and Kenya's Homa Bay, Siaya, Busia, Kakamega, and Vihita regions were at a higher risk of contracting P. falciparum malaria than their neighbors in seven East African nations. However, the Southern Nations, nationalities, and people, as well as the Oromia, Harari, Afar, and Amhara areas in Ethiopia, and the Blue Nile in Sudan, are the regions with a higher risk of P. vivax malaria than their bordering regions. For both P. falciparum and P. vivax, the spatially coordinated main effect and the unstructured spatial effect show minimal fluctuation across and within 115 regions during the study period. Through a random walk across 115 regions, the time-structured effect of P. falciparum malaria risk shows linear increases, whereas the temporally structured effect of P. vivax shows increases from 2011 to 2014 and decreases from 2017 to 2020.
Conclusions: The global malaria control and eradication effort should concentrate particularly on the South Sudan and Ethiopia regions to provide more intervention control to lower the risk of malaria incidence in East African countries, as both countries have high levels of P. falciparum and P. vivax, respectively.
Keywords: Bayesian; Ethiopia; Integrated nested Laplace approximation; International border; Malaria; Parasites.
© 2025. The Author(s).
Conflict of interest statement
Declarations. Ethics approval and consent to participate: Not applicable. Consent for publication: Not applicable. Competing interests: The authors declare that they have no competing interests.
Figures
References
-
- World Health Organization.World malaria report 2021. https://cdn.who.int/media/docs/default-source/malaria/world-malaria-repo.... Accessed 22 Nov 2024.
-
- Primrose SR, Primrose SR. Microbiology of infectious disease. Oxford: Oxford University Press; 2022.
-
- Coatney GR, and A. Primate Malarias. 1st ed. Bethesda: US NIAID; 1971.
-
- Cyril P. Malaria parasites and other Haemosporidia. Oxford: Blackwell; 1966.
MeSH terms
LinkOut - more resources
Full Text Sources
