

Physiological Responses and Histopathological Changes in Narrow-Clawed Crayfish (Pontastacus leptodactylus) Under Acute Thermal Stress
- PMID: 40646737
- PMCID: PMC12248993
- DOI: 10.3390/ani15131837
Physiological Responses and Histopathological Changes in Narrow-Clawed Crayfish (Pontastacus leptodactylus) Under Acute Thermal Stress
Abstract
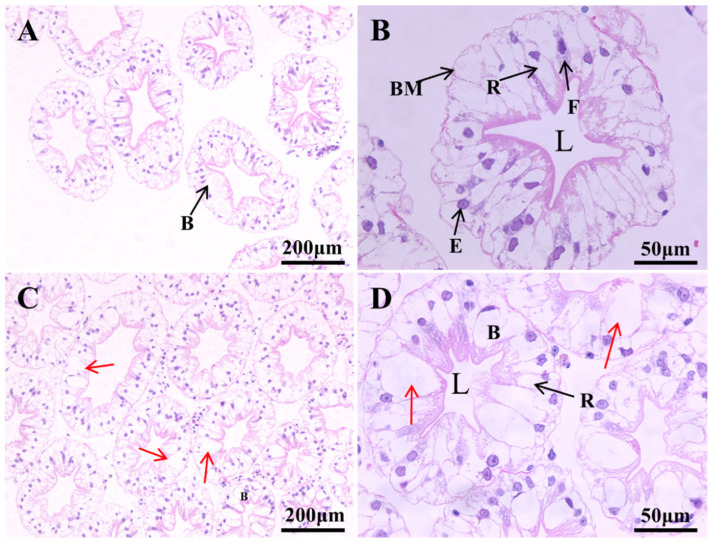
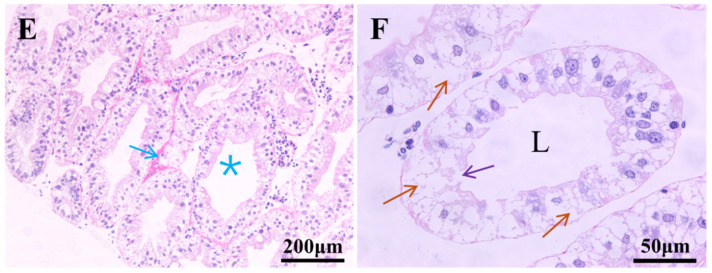
To investigate thermal tolerance, physiological responses, and molecular mechanisms of the narrow-clawed crayfish (Pontastacus leptodactylus) under acute thermal stress, the P. leptodactylus were acutely exposed to 4 different temperature groups-15 °C (control), 20 °C (T20), 25 °C (T25), and 30 °C (T30)-across 6 time points (3 h, 6 h, 12 h, 24 h, 48 h, and 72 h). Survival rates were recorded at each interval. Subsequent analyses comprised: (1) Hemolymph biochemical parameter determination; (2) hepatopancreatic antioxidant capacity assessment; (3) hepatopancreatic histopathology; and (4) comparative transcriptomics analysis of the hepatopancreas. The results showed that the survival rate in the T30 group significantly declined after 48 h of stress. The histological analysis of the hepatopancreas revealed tissue damage in both the T25 and T30 groups. The T25 group exhibited a notable increase in B-cell density and severe vacuolization, while the T30 group displayed disorganized hepatopancreatic cell arrangement, marked necrosis, and structural phenotypes in hepatopancreatic tubules, including lumen expansion and the loss of the star-shaped lumen structure. Biochemical analyses indicated pronounced declines in energy metabolism markers under elevated temperatures. Furthermore, the T30 group exhibited elevated levels of reactive oxygen species (ROS), malondialdehyde (MDA), superoxide dismutase (SOD), and catalase (CAT), alongside diminished total antioxidant capacity (T-AOC). Similarly, the T25 group displayed increased MDA and CAT levels but decreased T-AOC. Comparative transcriptomic analysis demonstrated that differentially expressed genes (DEGs) in the control vs. T25 group were predominantly enriched in metabolic pathways, whereas DEGs identified in control vs. T30 and T25 vs. T30 comparisons showed significant enrichment in energy metabolism and apoptotic processes. Based on these findings, we concluded that acute thermal stress induces mortality in P. leptodactylus through hepatopancreatic structural damage, energy metabolism dysregulation, and excessive ROS accumulation. Notably, P. leptodactylus should be excluded from aquaculture environments exceeding 25 °C. These results enhance understanding of the adaptive mechanisms of P. leptodactylus under acute thermal stress and provide actionable insights to advance its industrial cultivation.
Keywords: RNA-seq; energy metabolism; narrow-clawed crayfish; thermal stress.
Conflict of interest statement
The authors declare no conflicts of interest.
Figures


References
-
- Alvanou M.V., Feidantsis K., Lattos A., Stoforiadi A., Apostolidis A.P., Michaelidis B., Giantsis I.A. Influence of temperature on embryonic development of Pontastacus leptodactylus freshwater crayfish, and characterization of growth and osmoregulation related genes. BMC Zool. 2024;9:8. doi: 10.1186/s40850-024-00198-9. - DOI
-
- Nuc Z., Brusotti G., Catenacci L., Grenha A., Pontes J.F., Pinto da Silva J., Rosa da Costa A.M., Moro P., Milanese C., Grisoli P., et al. Pontastacus leptodactylus (Eschscholtz, 1823) and Faxonius limosus (Rafinesque, 1817) as New, Alternative Sources of Chitin and Chitosan. Water. 2023;15:3024. doi: 10.3390/w15173024. - DOI
-
- Ölçülü A., Kumlu M., Yilmaz H.A., EroldoĞAn O.T. Thermal Tolerance of Turkish Crayfish (Astacus leptodactylus) Acclimated to Three Different Temperatures. J. Limnol. Freshw. Fish. Res. 2019;5:1–5. doi: 10.17216/limnofish.422903. - DOI
-
- Berber S., Acarlı S., Bayraklı B., Kale S., Kızılkaya B., Vural P., Acarlı D. Monthly variation of fatty acids, lipid quality index and metal content of Pontastacus leptodactylus (Eschscholtz, 1823) in Atikhisar Dam Lake (Çanakkale, Türkiye) Environ. Sci. Pollut. Res. 2024;31:27014–27036. doi: 10.1007/s11356-024-32858-1. - DOI - PMC - PubMed
Grants and funding
LinkOut - more resources
Full Text Sources
Miscellaneous
