. 2025 Jul 5;15(13):1981.
doi: 10.3390/ani15131981.

Integrated Transcriptomic and Proteomic Analysis Reveals Differential Gene and Protein Expression and Signaling Pathways During a 20 Km Endurance Exercise and Recovery in Mongolian Horses

Affiliations

Integrated Transcriptomic and Proteomic Analysis Reveals Differential Gene and Protein Expression and Signaling Pathways During a 20 Km Endurance Exercise and Recovery in Mongolian Horses

Xinzhuang Zhang et al. Animals (Basel). .

Abstract

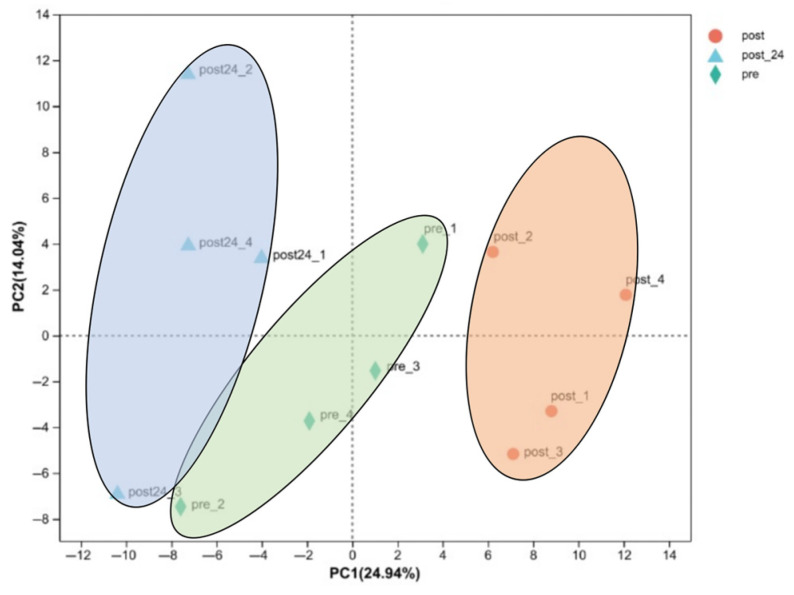
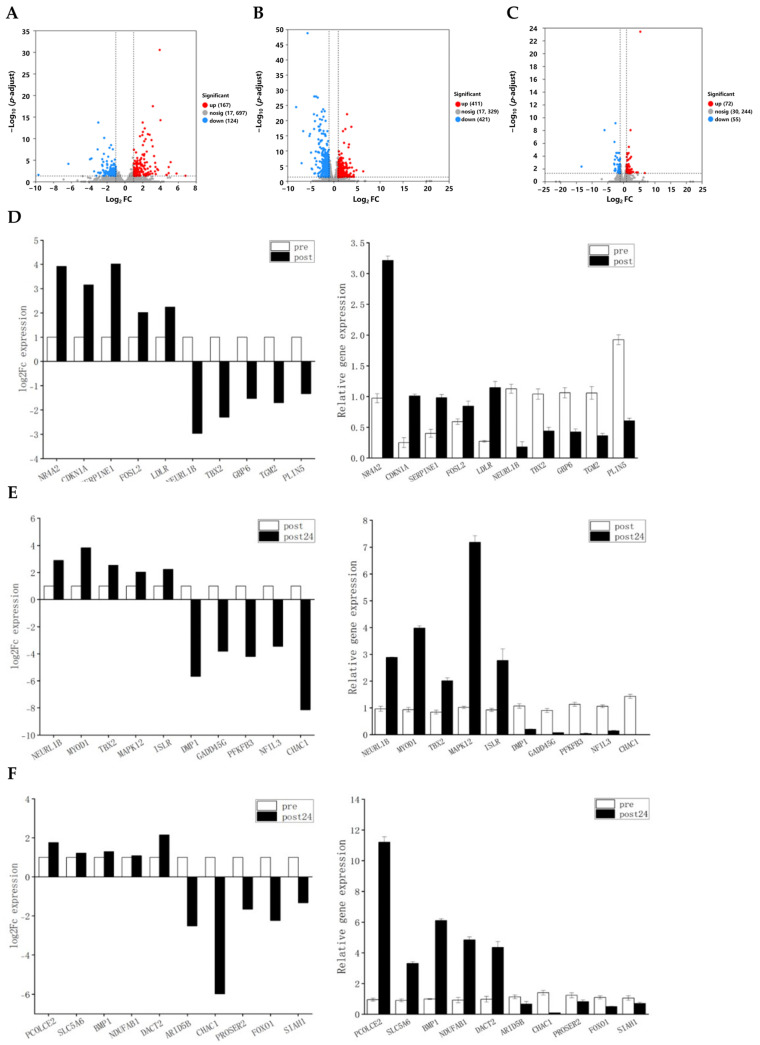
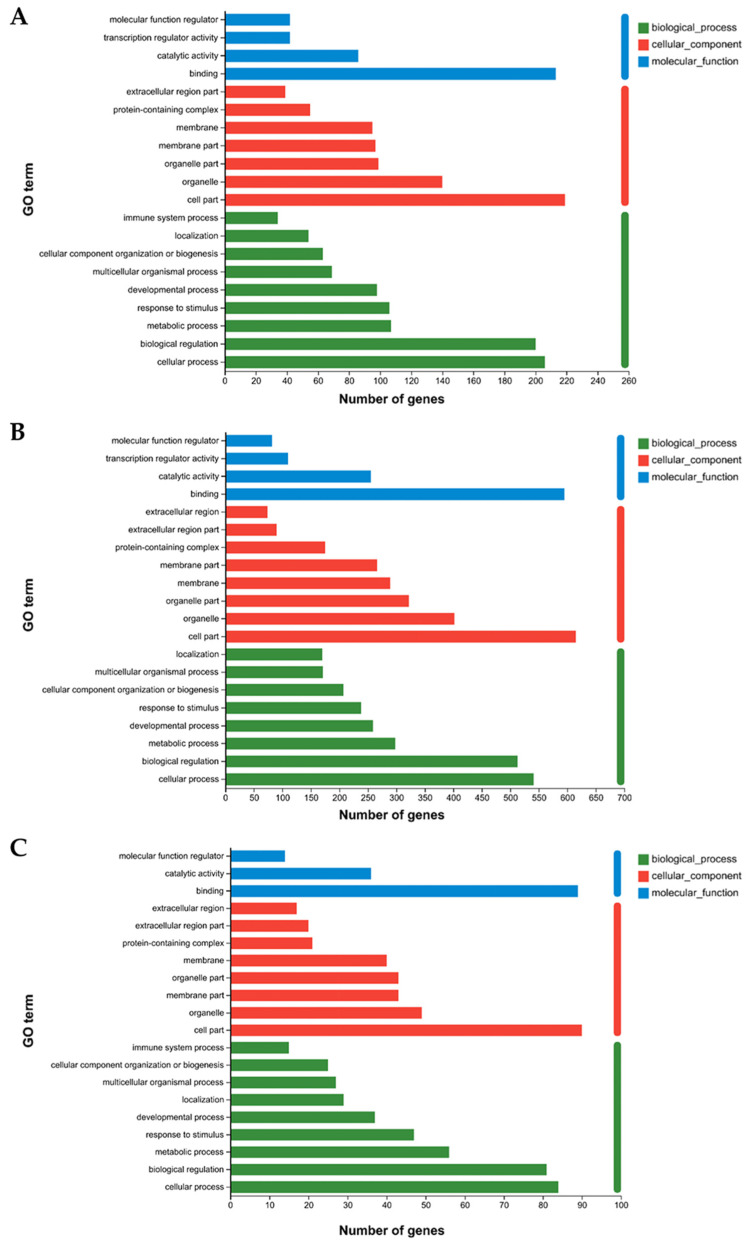
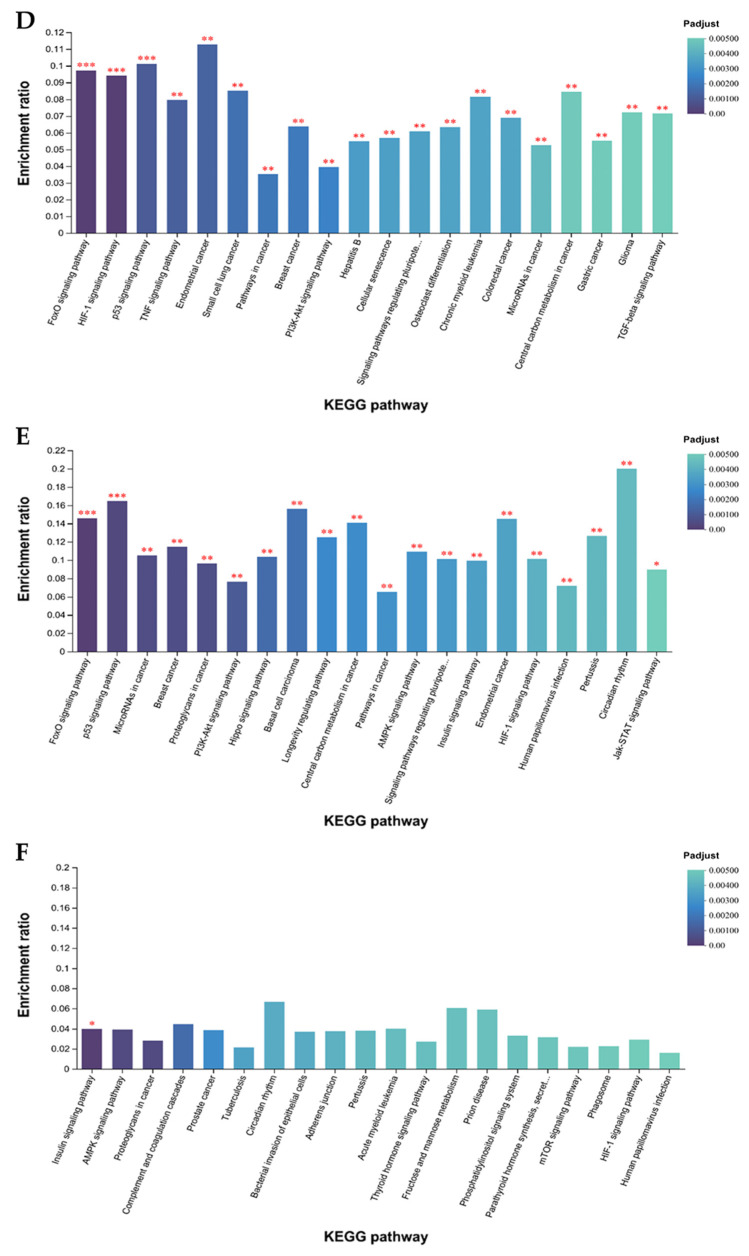
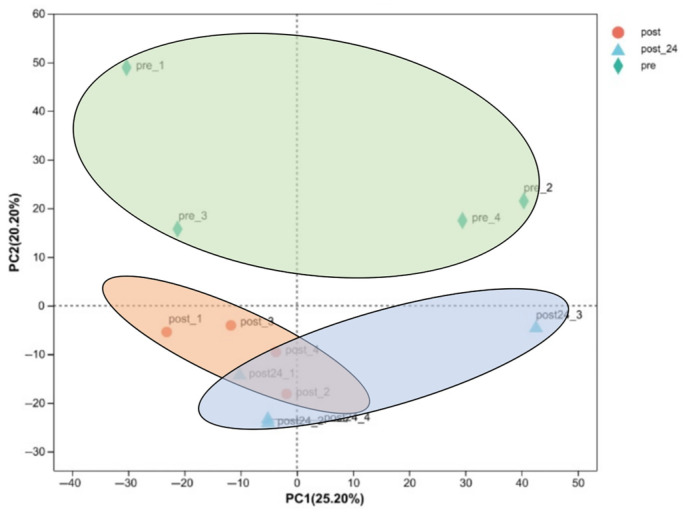
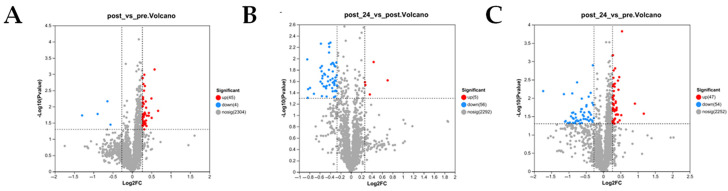
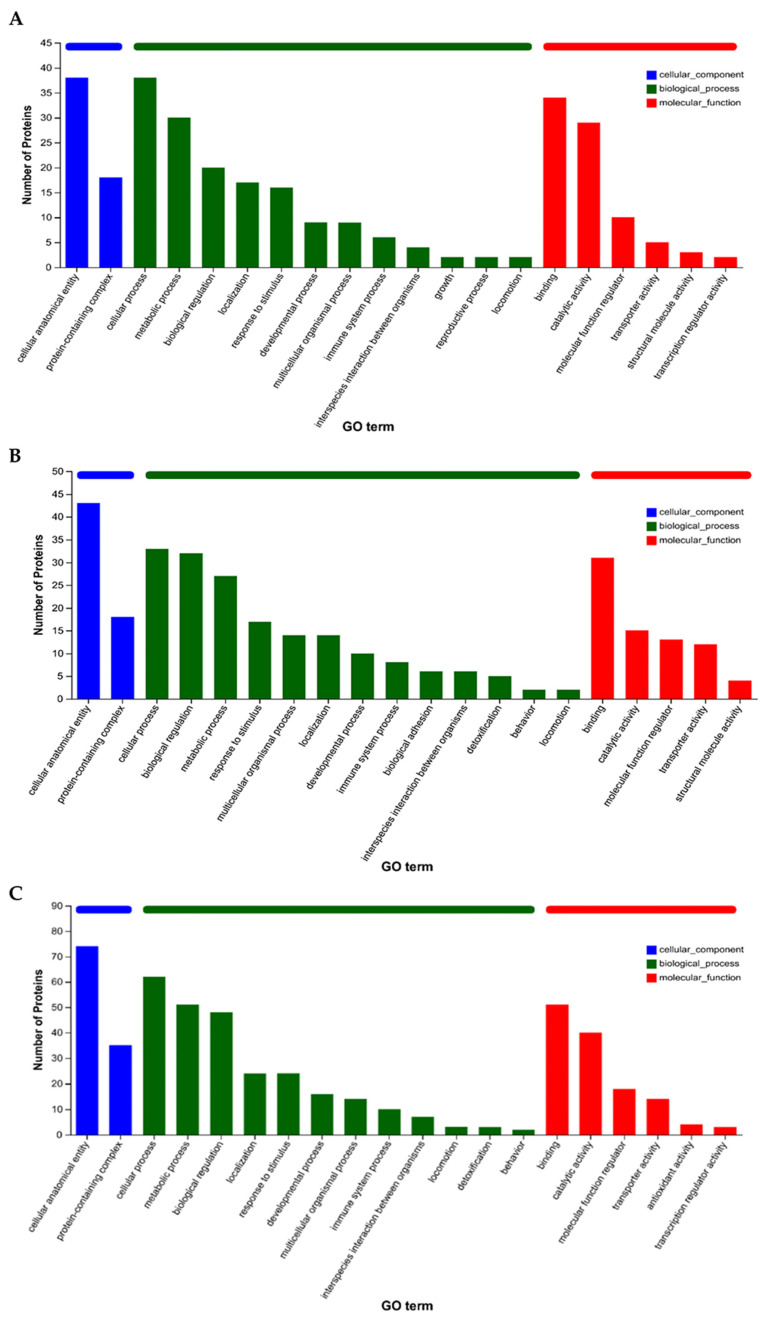
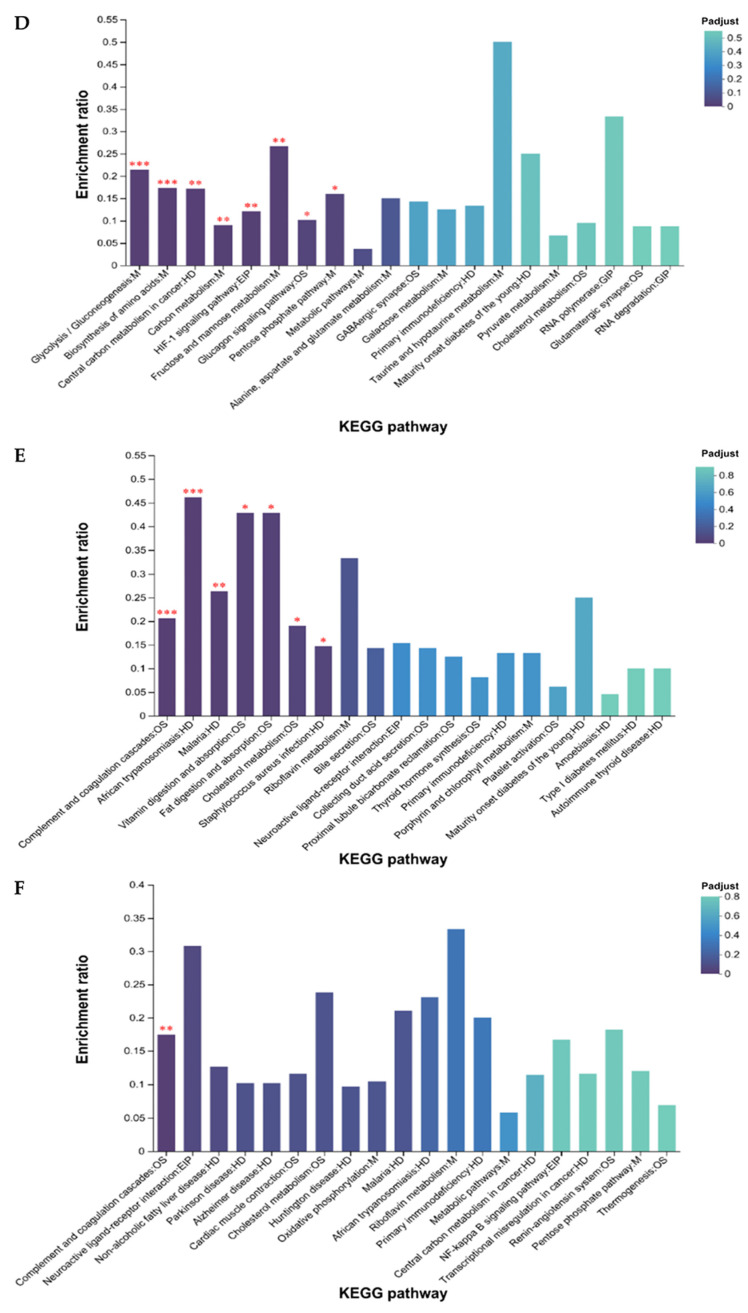
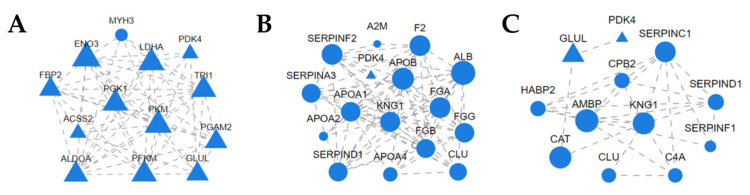
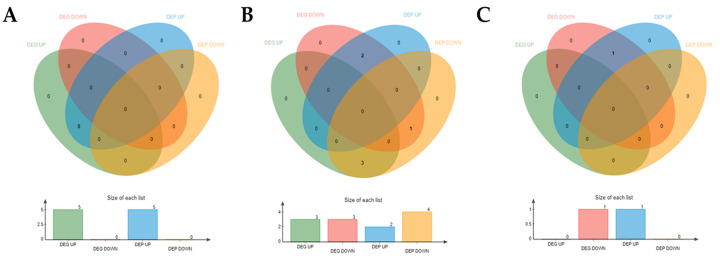
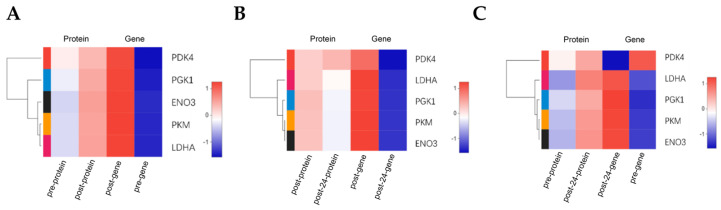
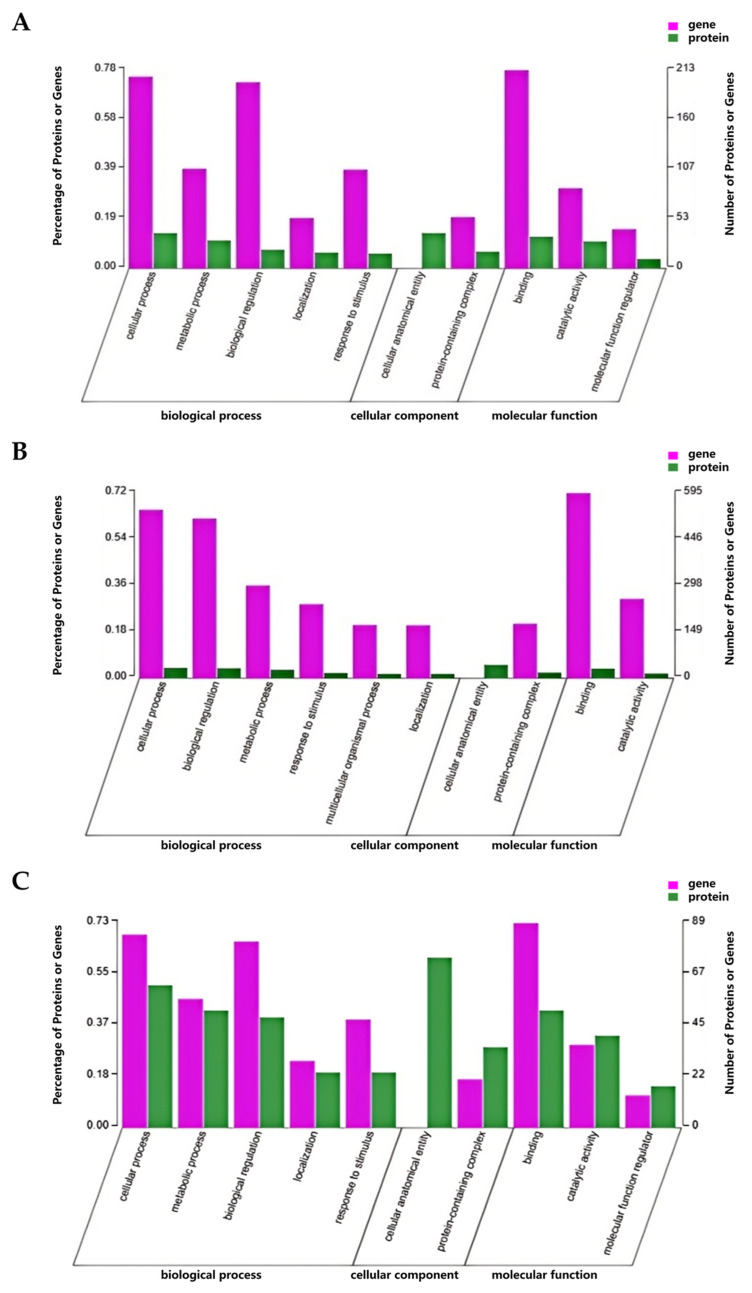
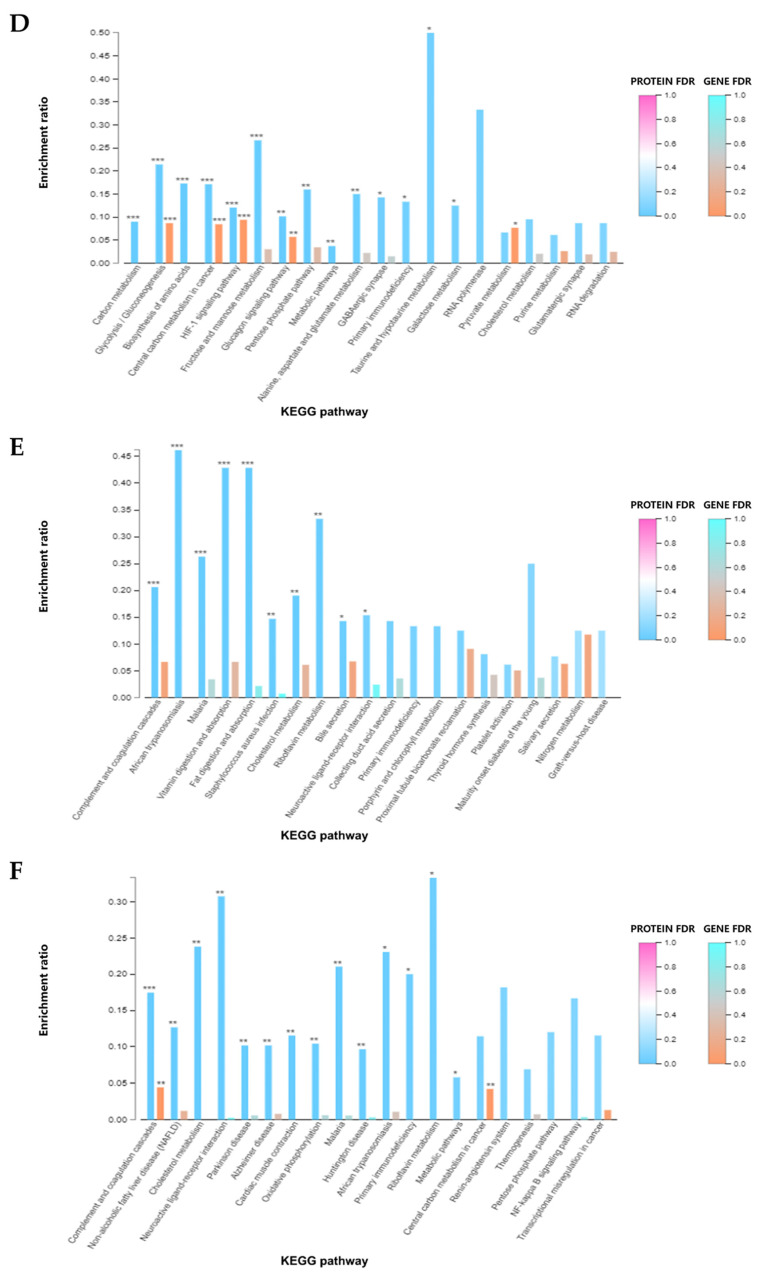
Mongolian horses are renowned for their remarkable endurance and ability to adapt to harsh environments. To delve deeper into the molecular mechanisms that underlie these traits, researchers conducted a comprehensive analysis of transcriptomic and proteomic changes in Mongolian horses at three distinct time points: before, immediately after, and 24 h following a 20 km run. The transcriptomic analysis uncovered significant variations in gene expression patterns across these time points. Specifically, 291 differentially expressed genes (DEGs) were identified when comparing pre-exercise to post-exercise conditions, 832 DEGs in the comparison between post-exercise and 24 h post-exercise, and 127 DEGs in the comparison of pre-exercise to 24 h post-exercise. Notably, key genes involved in metabolic activities and cellular proliferation, such as PI3K and LDHA, exhibited significant upregulation immediately after exercise but demonstrated a downward trend 24 h post-exercise. Concurrently, the proteomic analysis revealed 49 differentially expressed proteins (DEPs) in the pre-exercise versus post-exercise comparison, 61 DEPs in the post-exercise versus 24 h post-exercise comparison, and 101 DEPs in the pre-exercise versus 24 h post-exercise comparison. Some proteins, like PDK4 and GLUL, remained upregulated at 24 h post-exercise, whereas others, such as PFKM and LDHA, showed signs of recovery or downregulation. By integrating the transcriptomic and proteomic data, we were able to pinpoint overlapping DEGs/DEPs and implicate crucial signaling pathways, including the HIF-1 signaling pathway and glycolysis, in the molecular response of Mongolian horses to exercise. These findings offer insights into the endurance adaptation mechanisms of the Mongolian horse.

Keywords: Mongolian horses; adaptive response; endurance; exercise; proteomic analysis; transcriptomic analysis.


Conflict of interest statement

The authors declare no conflicts of interest.

Figures

Figure 1
Figure 1
PCA of the transcriptome pre- and post-exercise. The sample points in the figure are marked with different colors and shapes: orange circles represent “post-exercise” samples; blue triangles represent “24 h post-exercise” samples, and green diamonds represent “pre-exercise” samples. The sample points form several distinct clusters: the left cluster is mainly composed of “24 h post-exercise” samples, the middle cluster contains “pre-exercise” samples, and the right cluster is mainly composed of “post-exercise” samples.
Figure 2
Figure 2
DEGs analysis volcano plot and statistical significance display. (A) Volcano plot of expression differences between pre- and post-exercise. Red points indicate significantly upregulated genes; blue points indicate significantly downregulated genes, and gray points indicate non-significant genes. (B) Volcano plot of expression differences between post-exercise and 24 h post-exercise. Red points indicate significantly upregulated genes; blue points indicate significantly downregulated genes, and gray points indicate non-significant genes. (C) Volcano plot of expression differences between pre-exercise and 24 h post-exercise. Red points indicate significantly upregulated genes; blue points indicate significantly downregulated genes, and gray points indicate non-significant genes. (D) Comparison plot of RNA-Seq and RT-qPCR for differentially expressed genes pre- and post-exercise. (E) Comparison plot of RNA-Seq and RT-qPCR for differentially expressed genes between post-exercise and 24 h post-exercise. (F) Comparison plot of RNA-Seq and RT-qPCR for differentially expressed genes between pre-exercise and 24 h post-exercise.
Figure 3
Figure 3
GO and KEGG enrichment analysis of DEGs. (A) Numbers of genes falling within enriched GO terms pre- and post-exercise. (B) Numbers of genes falling within enriched GO terms post-exercise and 24 h post-exercise. (C) Numbers of genes falling within enriched GO terms pre- and 24 h post-exercise. (D) Plot of KEGG enrichment analysis comparing pre- and post-exercise. *** denotes p-adjust < 0.001, ** denotes p-adjust < 0.01. (E) Plot of KEGG enrichment analysis comparing post-exercise and 24 h post-exercise. *** denotes p-adjust < 0.001, ** denotes p-adjust < 0.01, and * denotes p-adjust < 0.05. (F) Plot of KEGG enrichment analysis comparing pre- and 24 h post-exercise. * denotes p-adjust < 0.05.
Figure 3
Figure 3
GO and KEGG enrichment analysis of DEGs. (A) Numbers of genes falling within enriched GO terms pre- and post-exercise. (B) Numbers of genes falling within enriched GO terms post-exercise and 24 h post-exercise. (C) Numbers of genes falling within enriched GO terms pre- and 24 h post-exercise. (D) Plot of KEGG enrichment analysis comparing pre- and post-exercise. *** denotes p-adjust < 0.001, ** denotes p-adjust < 0.01. (E) Plot of KEGG enrichment analysis comparing post-exercise and 24 h post-exercise. *** denotes p-adjust < 0.001, ** denotes p-adjust < 0.01, and * denotes p-adjust < 0.05. (F) Plot of KEGG enrichment analysis comparing pre- and 24 h post-exercise. * denotes p-adjust < 0.05.
Figure 4
Figure 4
PCA of the proteome pre- and post-exercise. The sample points in the graph are represented by different colors and shapes: orange circles represent “post-exercise” samples; blue triangles represent “24 h post-exercise” samples, and green diamonds represent “pre-exercise” samples. The sample points form several distinct clusters: the cluster on the left is mainly composed of “24 h post-exercise” samples; the cluster in the middle contains “pre-exercise” samples, and the cluster on the right is mainly composed of “post-exercise” samples.
Figure 5
Figure 5
DEP analysis volcano plot. (A) Volcano plot of expression differences between pre-exercise and post-exercise. Red points indicate significantly upregulated proteins; blue points indicate significantly downregulated proteins, and gray points indicate non-significant proteins. (B) Volcano plot of expression differences between post-exercise and 24 h post-exercise. Red points indicate significantly upregulated proteins; blue points indicate significantly downregulated proteins, and gray points indicate non-significant proteins. (C) Volcano plot of expression differences between pre-exercise and 24 h post-exercise. Red points indicate significantly upregulated proteins, blue points indicate significantly downregulated proteins, and gray points indicate non-significant proteins.
Figure 6
Figure 6
GO and KEGG enrichment analyses of DEPs. (A) Numbers of genes falling within enriched GO terms pre- and post-exercise. (B) Numbers of genes falling within enriched GO terms post-exercise and 24 h post-exercise. (C) Numbers of genes falling within enriched GO terms pre- and 24 h post-exercise. (D) Plot of KEGG enrichment analysis comparing pre- and post-exercise. *** denotes p-adjust < 0.001, ** denotes p-adjust < 0.01, and * denotes p-adjust < 0.05. (E) Plot of KEGG enrichment analysis comparing post-exercise and 24 h post-exercise. *** denotes p-adjust < 0.001, ** denotes p-adjust < 0.01, and * denotes p-adjust < 0.05. (F) Plot of KEGG enrichment analysis comparing pre- and 24 h post-exercise. ** denotes p-adjust < 0.01.
Figure 6
Figure 6
GO and KEGG enrichment analyses of DEPs. (A) Numbers of genes falling within enriched GO terms pre- and post-exercise. (B) Numbers of genes falling within enriched GO terms post-exercise and 24 h post-exercise. (C) Numbers of genes falling within enriched GO terms pre- and 24 h post-exercise. (D) Plot of KEGG enrichment analysis comparing pre- and post-exercise. *** denotes p-adjust < 0.001, ** denotes p-adjust < 0.01, and * denotes p-adjust < 0.05. (E) Plot of KEGG enrichment analysis comparing post-exercise and 24 h post-exercise. *** denotes p-adjust < 0.001, ** denotes p-adjust < 0.01, and * denotes p-adjust < 0.05. (F) Plot of KEGG enrichment analysis comparing pre- and 24 h post-exercise. ** denotes p-adjust < 0.01.
Figure 7
Figure 7
(A) Protein interaction network analysis pre- and post-exercise. Nodes represent proteins, with triangles indicating upregulated proteins and circles indicating downregulated proteins. Edges represent interactions between two proteins. The size of a node is proportional to its connectivity; that is, the more edges are connected to this node, the greater its connectivity, and the larger the node, indicating that the gene of this node has greater importance in the network. (B) Protein interaction network analysis comparing immediately post-exercise and 24 h post-exercise conditions. (C) Protein interaction network analysis comparing pre-exercise and 24 h post-exercise conditions.
Figure 8
Figure 8
Venn diagram showing differential expression of correlated data. (A) Venn diagram showing differential expression of genes and proteins before versus after exercise. (B) Venn diagram showing differential expression of genes and proteins immediately after exercise versus 24 h post-exercise. (C) Venn diagram showing differential expression of genes and proteins before exercise versus 24 h post-exercise.
Figure 9
Figure 9
Heat map of correlated data expression. (A) Heat map comparing gene and protein expression levels before versus after exercise. (B) Heat map comparing gene and protein expression levels immediately after exercise versus 24 h post-exercise. (C) Heat map comparing gene and protein expression levels before exercise versus 24 h post-exercise.
Figure 10
Figure 10
GO and KEGG enrichment analyses of DEGs and DEPs. (A) Statistics for GO classification pre- and post-exercise. (B) Statistics for GO classification immediately post-exercise and 24 h post-exercise. (C) Statistics for GO classification pre- and 24 h post-exercise. (D) Plot of KEGG enrichment analysis comparing pre- and post-exercise. *** denotes FDR < 0.001, ** denotes FDR < 0.01, and * denotes FDR < 0.05. (E) Plot of KEGG enrichment analysis comparing post-exercise and 24 h post-exercise. *** denotes FDR < 0.001, ** denotes FDR < 0.01, and * denotes FDR < 0.05. (F) Plot of KEGG enrichment analysis comparing pre- and 24 h post-exercise. *** denotes FDR < 0.001, ** denotes FDR < 0.01, and * denotes FDR < 0.05.
Figure 10
Figure 10
GO and KEGG enrichment analyses of DEGs and DEPs. (A) Statistics for GO classification pre- and post-exercise. (B) Statistics for GO classification immediately post-exercise and 24 h post-exercise. (C) Statistics for GO classification pre- and 24 h post-exercise. (D) Plot of KEGG enrichment analysis comparing pre- and post-exercise. *** denotes FDR < 0.001, ** denotes FDR < 0.01, and * denotes FDR < 0.05. (E) Plot of KEGG enrichment analysis comparing post-exercise and 24 h post-exercise. *** denotes FDR < 0.001, ** denotes FDR < 0.01, and * denotes FDR < 0.05. (F) Plot of KEGG enrichment analysis comparing pre- and 24 h post-exercise. *** denotes FDR < 0.001, ** denotes FDR < 0.01, and * denotes FDR < 0.05.

Similar articles

References

    1. Liu Y., Sinjab A., Min J., Han G., Paradiso F., Zhang Y., Wang R., Pei G., Dai Y., Liu Y., et al. Conserved spatial subtypes and cellular neighborhoods of cancer-associated fibroblasts revealed by single-cell spatial multi-omics. Cancer Cell. 2025;43:905–924. doi: 10.1016/j.ccell.2025.03.004. - DOI - PMC - PubMed
    1. Ayantoye J.O., Kolachi H.A., Zhang X., Shahzad M., Kandil O.M.T., Wan P., Zhao X. Advances in Timed Artificial Insemination: Integrating Omics Technologies for Enhanced Reproductive Efficiency in Dairy Cattle. Animals. 2025;15:816. doi: 10.3390/ani15060816. - DOI - PMC - PubMed
    1. Yang L., Li P., Huang X., Wang C., Zeng Y., Wang J., Yao X., Meng J. Effects of Combined Transcriptome and Metabolome Analysis Training on Athletic Performance of 2-Year-Old Trot-Type Yili Horses. Genes. 2025;16:197. doi: 10.3390/genes16020197. - DOI - PMC - PubMed
    1. Wang J., Ren W., Li Z., Li L., Wang R., Ma S., Zeng Y., Meng J., Yao X. Regulatory Mechanisms of Yili Horses During an 80 km Race Based on Transcriptomics and Metabolomics Analyses. Int. J. Mol. Sci. 2025;26:2426. doi: 10.3390/ijms26062426. - DOI - PMC - PubMed
    1. Wang J., Ren W., Sun Z., Han Z., Zeng Y., Meng J., Yao X. Comparative transcriptome analysis of slow-twitch and fast-twitch muscles in Kazakh horses. Meat. Sci. 2024;216:109582. doi: 10.1016/j.meatsci.2024.109582. - DOI - PubMed

LinkOut - more resources