A Hydrophobic Ratiometric Fluorescent Indicator Film Using Electrospinning for Visual Monitoring of Meat Freshness
- PMID: 40646952
- PMCID: PMC12248453
- DOI: 10.3390/foods14132200
A Hydrophobic Ratiometric Fluorescent Indicator Film Using Electrospinning for Visual Monitoring of Meat Freshness
Abstract
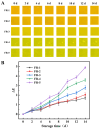
A ratiometric fluorescent film with high gas sensitivity and stability was developed using electrospinning technology for monitoring food spoilage. 5(6)-Carboxyfluorescein (5(6)-FAM) was used as the indicator, combined with the internal reference Rhodamine B (RHB), to establish a composite ratiometric fluorescent probe (FAM@RHB). The hydrophobic fluorescent films were fabricated by incorporating FAM@RHB probes into polyvinylidene fluoride (PVDF) at varying molar ratios through electrospinning. The FR-2 film with a 2:8 ratio of 5(6)-FAM to RHB exhibited the best performance, demonstrating excellent hydrophobicity with a water contact angle (WCA) of 113.45° and good color stability, with a ΔE value of 2.05 after 14 days of storage at 4 °C. Gas sensitivity tests indicated that FR-2 exhibited a limit of detection (LOD) of 0.54 μM for trimethylamine (TMA). In the application of monitoring the freshness of pork and beef at 4 °C, the fluorescence color of the FR-2 film significantly changed from orange-yellow to green, enabling the visual monitoring of meat freshness. Hence, this study provides a new approach for intelligent food packaging.
Keywords: electrospinning; food freshness; hydrophobic; intelligent packaging; ratiometric fluorescent film.
Conflict of interest statement
The authors declare no conflicts of interest.
Figures


Similar articles
-
A ratiometric fluorescent electrospun film with high amine sensitivity and stability for visual monitoring of livestock meat freshness.Food Chem X. 2024 Sep 2;24:101801. doi: 10.1016/j.fochx.2024.101801. eCollection 2024 Dec 30. Food Chem X. 2024. PMID: 39290751 Free PMC article.
-
Application of sodium alginate-pectin active intelligent film containing anthocyanins from Aronia melanocarpa and tea polyphenols in pork preservation and freshness monitoring.Meat Sci. 2025 Aug 12;230:109931. doi: 10.1016/j.meatsci.2025.109931. Online ahead of print. Meat Sci. 2025. PMID: 40845473
-
Starch/ polyvinyl alcohol/Brazilein film with enhanced stability by using medium-chain triglycerides emulsion for real-time meat freshness monitoring.Int J Biol Macromol. 2025 Aug 19:146989. doi: 10.1016/j.ijbiomac.2025.146989. Online ahead of print. Int J Biol Macromol. 2025. PMID: 40840745
-
Plant betalains-mixed active/intelligent films for meat freshness monitoring: A review of the fabrication parameters.J Food Sci Technol. 2024 Jul;61(7):1238-1251. doi: 10.1007/s13197-023-05881-2. Epub 2023 Nov 13. J Food Sci Technol. 2024. PMID: 38910928 Free PMC article. Review.
-
The effect of sample site and collection procedure on identification of SARS-CoV-2 infection.Cochrane Database Syst Rev. 2024 Dec 16;12(12):CD014780. doi: 10.1002/14651858.CD014780. Cochrane Database Syst Rev. 2024. PMID: 39679851 Free PMC article.
References
-
- Shi J.Y., Liu C.A.P., Li Z.H., Huang X.W., Zhai X.D., Hu X.T., Zhang X.A., Zhang D., Zou X.B. Detection of Low Chromaticity Difference Foreign Matters in Soy Protein Meat Based on Hyperspectral Imaging Technology. Spectrosc. Spectr. Anal. 2022;42:1299–1305. doi: 10.3964/j.issn.1000-0593(2022)04-1299-07. - DOI
-
- Sun Z., Liang L., Yan X., Zou X., Wang T., Liu X., Li J. Detection of Freshness Indexes of Imported Chilled Beef Using Hyperspectral Imaging Technology. Food Sci. 2020;41:315–323.
-
- Zhang D., Wang Y., Geng W., Liu H. Rapid detection of tryptamine by optosensor with molecularly imprinted polymers based on carbon dots-embedded covalent-organic frameworks. Sens. Actuators B-Chem. 2019;285:546–552. doi: 10.1016/j.snb.2019.01.092. - DOI
Grants and funding
- 2023YFE0105500/National Key Research and Development Program of China
- 2024YFE0117000/National Key Research and Development Program of China
- 32102080/National Natural Science Foundation of China
- 31801631/National Natural Science Foundation of China
- 1601360061/National Natural Science Foundation of China
- 32150410347/National Natural Science Foundation of China
- 32272407/National Natural Science Foundation of China
- ZJ2022135/Zhejiang Postdoctoral Programs
- 2022NKY05/Postdoctoral project of Institute of Modern Agriculture and Health Care Industry of Wencheng
- BK20220058/Natural Science Foundation of Jiangsu Province
- BK20200103/Natural Science Foundation of Jiangsu Province
- BK2022011/Natural Science Foundation of Jiangsu Province
- 202074/Foundation of Jiangsu Specially-Appointed Professor
LinkOut - more resources
Full Text Sources

