. 2025 Jun 29;14(13):2309.
doi: 10.3390/foods14132309.

Effects of Muscle Fiber Composition on Meat Quality, Flavor Characteristics, and Nutritional Traits in Lamb

Affiliations

Effects of Muscle Fiber Composition on Meat Quality, Flavor Characteristics, and Nutritional Traits in Lamb

Yu Fu et al. Foods. .

Abstract

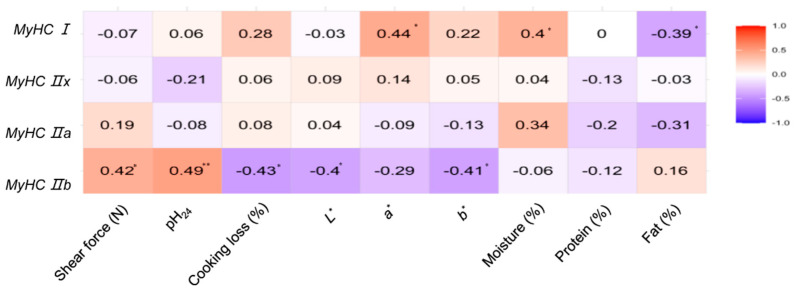
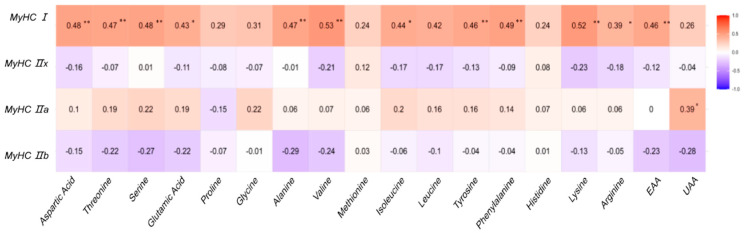
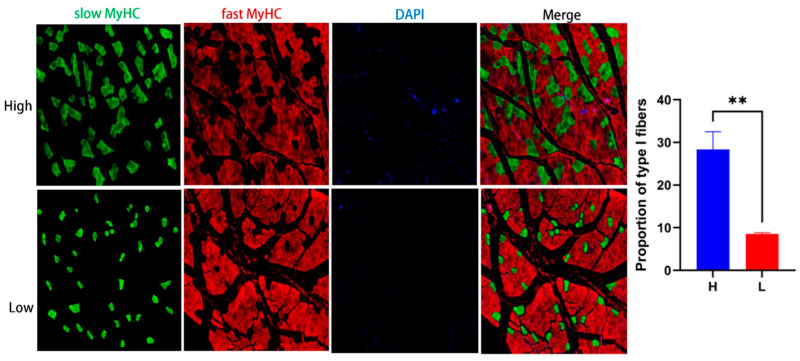
Skeletal muscle fiber type composition critically influences lamb meat quality. This study examined the relationships between muscle fiber types and key quality traits, including tenderness, color, lipid and amino acid profiles, and volatile flavor compounds. MyHC I (slow-twitch oxidative fibers) positively correlated with desirable traits such as increased redness, water-holding capacity, unsaturated fatty acids, and essential amino acids. Conversely, MyHC IIb (fast glycolytic fibers) was linked to reduced tenderness and higher levels of off-flavor compounds. MyHC IIa and IIx showed minimal effects. Untargeted metabolomics comparing muscles with high versus low slow-twitch fiber proportions revealed differential metabolites enriched in sphingolipid and arginine-proline metabolism pathways. These results suggest that a higher proportion of oxidative fibers enhances both the sensory and nutritional qualities of lamb meat by modulating lipid metabolism, amino acid availability, and flavor formation.

Keywords: amino acid; fatty acid; metabolomics; muscle fiber type; volatile flavor compounds.


Conflict of interest statement

The authors declare no conflict of interest.

Figures

Figure 1
Figure 1
Association between MyHC isoforms and meat quality traits. The intensity of the color corresponds to the magnitude of the correlation coefficient (r). Significance levels are indicated by asterisks: * p < 0.05; ** p < 0.01.
Figure 2
Figure 2
Relationship between MyHC isoforms and muscle lipid composition. The intensity of the color corresponds to the magnitude of the correlation coefficient (r). Significance levels are indicated by asterisks: * p < 0.05; ** p < 0.01.
Figure 3
Figure 3
Association between MyHC isoforms and free amino acid profiles. The intensity of the color corresponds to the magnitude of the correlation coefficient (r). Significance levels are indicated by asterisks: * p < 0.05; ** p < 0.01.
Figure 4
Figure 4
Correlation between muscle fiber types and volatile flavor compounds. The intensity of the color corresponds to the magnitude of the correlation coefficient (r). Significance levels are indicated by asterisks: * p < 0.05; ** p < 0.01.
Figure 5
Figure 5
Immunofluorescence images of longissimus lumborum muscle in lambs with high vs. low proportions of slow-twitch fibers. Representative images and quantification of slow-twitch (type I) fibers from the high and low groups (n = 6). Slow muscle fibers are stained with green fluorescence, fast muscle fibers are stained with red fluorescence, and the cell nuclei are blue. Bar graphs show mean ± standard error (SEM); ** indicates p < 0.01.
Figure 6
Figure 6
Bioinformatics analysis of metabolomic data. (A) Hierarchical clustering heatmap of differential metabolites. (B) Principal component analysis (PCA) plot of metabolite profiles. The 95% confidence intervals for each group are represented by ellipses, with the H group in pink and the L group in green. (C) Volcano plot showing significantly up- and downregulated metabolites between groups. (D) KEGG pathway enrichment analysis of differential metabolites.

Similar articles

References

    1. Juárez M., Lam S., Bohrer B.M., Dugan M.E.R., Vahmani P., Aalhus J., Juárez A., López-Campos O., Prieto N., Segura J. Enhancing the nutritional value of red meat through genetic and feeding strategies. Foods. 2021;10:872. doi: 10.3390/foods10040872. - DOI - PMC - PubMed
    1. Stewart S.M., Polkinghorne R., Pethick D.W., Pannier L. Carcass assessment and value in the Australian beef and sheep meat industry. Anim. Front. 2024;14:5–14. doi: 10.1093/af/vfae005. - DOI - PMC - PubMed
    1. Van Le H., Nguyen D., Nguyen Q., Malau-Aduli B., Nichols P., Malau-Aduli A. Fatty acid profiles of muscle, liver, heart and kidney of Australian prime lambs fed different polyunsaturated fatty acids enriched pellets in a feedlot system. Sci. Rep. 2019;9:1238. doi: 10.1038/s41598-018-37956-y. - DOI - PMC - PubMed
    1. Chikwanha O., Vahmani P., Muchenje V., Dugan M., Mapiye C. Nutritional enhancement of sheep meat fatty acid profile for human health and wellbeing. Food Res. Int. 2017;104:25–38. doi: 10.1016/j.foodres.2017.05.005. - DOI - PubMed
    1. Lefaucheur L. A second look into fibre typing—Relation to meat quality. Meat Sci. 2010;84:257–270. doi: 10.1016/j.meatsci.2009.05.004. - DOI - PubMed

LinkOut - more resources