. 2025 Jun 26;17(13):2115.
doi: 10.3390/nu17132115.

Obesity-Associated NAFLD Coexists with a Chronic Inflammatory Kidney Condition That Is Partially Mitigated by Short-Term Oral Metformin

Affiliations

Obesity-Associated NAFLD Coexists with a Chronic Inflammatory Kidney Condition That Is Partially Mitigated by Short-Term Oral Metformin

Amod Sharma et al. Nutrients. .

Abstract

Background/Objectives: Chronic kidney disease (CKD) is twice as prevalent in individuals with obesity-associated non-alcoholic fatty liver disease (Ob-NAFLD), highlighting the need to determine the link and mechanisms of kidney injury as well as explore therapies. Metformin, a first-line treatment for type 2 diabetes, shows promise in managing NAFLD, but its renal benefits in Ob-NAFLD remain unclear. This study investigates the impact of Ob-NAFLD on kidney injury and assesses the potential protective effects of metformin. Methods: Five-week-old female Zucker rats (obese fa/fa and lean Fa/Fa) were fed an AIN-93G diet for 8 weeks to induce Ob-NAFLD, then fed the diet with Metformin for 10 weeks. Kidneys were collected for histopathological and biochemical analyses. Results: Histopathological studies showed increased tubular injury, mesangial matrix expansion, and fibrosis in kidneys with Ob-NAFLD compared to lean control (LC) rats. Immunohistochemistry further revealed an elevated macrophage and neutrophil infiltration and increased levels of nitrotyrosine and p22phox in Ob-NAFLD kidneys. Furthermore, Ob-NAFLD rat kidneys showed upregulation of TNF-α and CCL2 genes and increased levels of caspase-3 (total and cleaved). Interestingly, metformin treatment significantly decreased TNF-α mRNA and blunted nitrotyrosine levels, and modestly reduced immune cell infiltration in Ob-NAFLD. Conclusions: These findings indicate that Ob-NAFLD promotes CKD as evidenced by tubular injury, oxidative stress, inflammation, and fibrosis. While short-term metformin treatment showed anti-oxidative and anti-inflammatory effects in Ob-NAFLD, its impact on structural kidney damage was limited, highlighting the need for longer treatment or alternative therapeutics such as oxidant scavengers and anti-inflammatory drugs to effectively mitigate renal pathologies.

Keywords: inflammation; kidney injury; metformin; obesity-NAFLD; oxidative stress.


Conflict of interest statement

The authors declare no conflicts of interest. The funders had no role in the design of the study; in the collection, analyses, or interpretation of data; in the writing of the manuscript; or in the decision to publish the results.

Figures
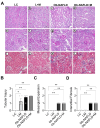
Figure 1
Figure 1
Effects of Ob-NAFLD and metformin treatment on rat kidney histopathology. Rat kidneys were isolated and processed for formalin-fixed paraffin-embedded sections. Three groups, namely lean control (LC), obesity associated NAFLD (Ob-NAFLD), and metformin treated Ob-NAFLD (Ob-NAFLD + M) were considered for histological evaluations. (A) Representative images of Periodic Acid–Schiff (PAS) (ah) and Masson’s Trichrome-stained kidney sections (il). (a,e,i) LC rats showing normal renal histology with intact tubular structure (a), no mesangial expansion (e), and absence of fibrosis (i). (b,f,j) Metformin-treated lean rats exhibiting tubular injury (b), no mesangial matrix expansion (f), and absence of interstitial fibrosis (j). (c,g,k) Ob-NAFLD rats exhibiting evident kidney damage, including tubular injury (c), mesangial matrix expansion (g), and interstitial fibrosis (k). (d,h,l) Metformin-treated Ob-NAFLD rat kidneys showing pathological features similar to untreated Ob-NAFLD rats, including moderate tubular injury (d), mesangial expansion (h), and fibrosis (l), indicating a lack of renal protective effect from short-term metformin treatment. Scale bars = 100 μm. (BD) Graphs showing pathological evaluation performed by a blinded renal pathologist. (B) Tubular injury scores, (C) mesangial matrix expansion score, and (D) interstitial fibrosis score across experimental groups. Data are expressed as mean ± SEM (n = 5 per group). Statistical significance between the two groups was determined by a non-parametric Mann–Whitney U test (* p < 0.05; ** p <0.01).
Figure 2
Figure 2
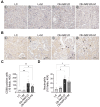
Evaluation of oxidative stress in the kidneys of Ob-NAFLD rats with or without metformin treatment. Rat kidney sections from lean control (LC), lean treated with metformin (L + M), obesity associated NAFLD (Ob-NAFLD), and metformin-treated Ob-NAFLD (Ob-NAFLD + M) groups were employed for immunohistochemistry of nitrotyrosine (a marker of reactive oxygen species). (A) Representative immunohistochemical images of nitrotyrosine staining (ad). Scale bars = 100 μm. (B) Graph showing semi-quantitative analysis of nitrotyrosine levels across experimental groups. Data are expressed as mean ± SEM (n = 5 per group). Statistical significance was determined by two-way ANOVA (* p < 0.05).
Figure 3
Figure 3
Immune cell infiltration in the kidneys of Ob-NAFLD rats with or without metformin treatment. Rat kidney sections from lean control (LC), lean treated with metformin (L + M), obesity associated NAFLD (Ob-NAFLD), and metformin-treated Ob-NAFLD (Ob-NAFLD = M) groups were employed for immunohistochemistry of CD68, a macrophage marker, and neutrophil elastase, a neutrophil marker. (A) Representative immunohistochemistry images showing CD68+ cells in rat kidneys of the following: (a) LC; (b) L + M; (c) Ob-NAFLD; and (d) Ob-NAFLD + M groups. Scale bars = 100 μm. (B) Representative immunohistochemistry images for neutrophil elastase+ cells in rat kidneys of the following: (a) LC; (b) L + M; (c) Ob-NAFLD; and (d) Ob-NAFLD + M groups. Scale bars = 100 μm. (C) Graph showing quantification of CD68+ cells within 10 microscopic fields (40×) across experimental groups. (D) Graph showing quantification of neutrophil elastase+ cells within 10 microscopic fields (40×) across experimental groups. Data are expressed as mean ± SEM (n = 5 per group). Statistical significance between the two groups was determined by a non-parametric Mann–Whitney U test (* p < 0.05; ** p < 0.01).
Figure 4
Figure 4
Expression of p22phox, a subunit of NADPH oxidase, in kidney tissues of Ob-NAFLD rats. Rat kidney sections from lean control (LC), lean treated with metformin (L + M), obesity associated NAFLD (Ob-NAFLD), and metformin-treated Ob-NAFLD (Ob-NAFLD = M) groups were employed for immunohistochemistry of p22phox, a subunit of NAPDH complex and a marker of reactive oxygen species production. (A) Representative immunohistochemistry images showing p22phox+ cells in rat kidneys of the following: (a) LC; (b) L + M; (c) Ob-NAFLD; and (d) Ob-NAFLD + M groups. Scale bars = 100 μm. (B) Graph showing quantification of p22phox+ cells within 10 microscopic fields (40×) across experimental groups. Data are expressed as mean ± SEM (n = 5 per group). Statistical significance between the two groups was determined by a non-parametric Mann–Whitney U test (** p < 0.01).
Figure 5
Figure 5
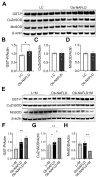
Antioxidant enzyme levels in the kidneys of Ob-NAFLD rats and the impact of metformin treatment. RIPA lysates were prepared from rat kidney homogenates followed by SDS-PAGE Western blotting. (A) Representative Western blot images of glutathione-S-transferase-P (GST-P), Cu/Zn-superoxide dismutase (Cu/Zn-SOD), and Mn-superoxide dismutase (Mn-SOD) in renal lysates from lean control (LC) and obesity associated NAFLD (Ob-NAFLD) groups. (B-D) Graphs showing densitometry analysis of protein bands of GST-P (B), CuZnSOD (C), and MnSOD (D) normalized to β-actin. (E) Representative Western blot images of glutathione-S-transferase-P (GST-P), Cu/Zn-superoxide dismutase (Cu/Zn-SOD), and Mn-superoxide dismutase (Mn-SOD) in renal lysates from lean treated with metformin (L + M), Ob-NAFLD, and metformin-treated Ob-NAFLD (Ob-NAFLD + M) groups. (F-H) Graphs showing densitometry analysis of protein bands of GST-P (F), CuZnSOD (G), and MnSOD (H) normalized to β-actin. Data are presented as mean ± SEM (n = 5 per group). Statistical significance between the two groups was determined by a non-parametric Mann–Whitney U test (* p < 0.05, ** p < 0.01).
Figure 6
Figure 6
Expression of inflammatory cytokine and chemokine genes in the kidneys of Ob-NAFLD rats with or without metformin treatment. Kidney tissues from lean control (LC), lean treated with metformin (L + M), Ob-NAFLD, and Ob-NAFLD treated with metformin (Ob-NAFLD + M) groups were used for mRNA isolation followed by complementary DNA (cDNA) synthesis. (AC) SYBR green PCR was used to quantify gene expression of tumor necrosis factor (TNF-α), a pro-inflammatory cytokine, chemokine ligand 2 (Ccl2), a chemoattractant for immune cell infiltration, and the CXC chemokine receptor 2 (CXCR2). Gene expression levels were normalized to β-actin and expressed as fold change relative to the LC group. Graphs showing quantitative real-time PCR analysis of TNF-α (A), Ccl2 (B), and CXCR2 (C) mRNA expression. Data are presented as mean ± SEM (n = 5 per group). Statistical analysis was performed using two-way ANOVA (* p < 0.05; **p < 0.01).
Figure 7
Figure 7
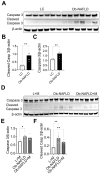
Effects of Ob-NAFLD on renal apoptosis and the impact of metformin treatment. RIPA lysates were prepared from rat kidney homogenates, followed by SDS-PAGE Western blotting. (A) Representative Western blot images of total caspase-3 and cleaved caspase-3 proteins in renal lysates from lean control (LC) and obesity associated NAFLD (Ob-NAFLD) groups. (B,C) Graphs showing densitometry analysis of protein bands of total caspase-3 (B) and cleaved caspase-3 proteins (C) normalized to β-actin. (D) Representative Western blot images of total caspase-3 and cleaved caspase-3 proteins in renal lysates from lean treated with metformin (L + M), Ob-NAFLD, and metformin-treated Ob-NAFLD (Ob-NAFLD + M) groups. (E,F) Graphs showing densitometry analysis of protein bands of total caspase-3 (E) and cleaved caspase-3 proteins (F) normalized to β-actin. Data are presented as mean ± SEM (n = 5 per group). Statistical significance between the two groups was determined by a non-parametric Mann–Whitney U test (* p < 0.05; **p < 0.01).

References

    1. Bikbov B., Purcell C.A., Levey A.S., Smith M., Abdoli A., Abebe M., Adebayo O.M., Afarideh M., Agarwal S.K., Agudelo-Botero M., et al. Global, regional, and national burden of chronic kidney disease, 1990–2017: A systematic analysis for the Global Burden of Disease Study 2017. Lancet. 2020;395:709–733. doi: 10.1016/S0140-6736(20)30045-3. - DOI - PMC - PubMed
    1. Byrne C.D., Targher G. NAFLD: A multisystem disease. J. Hepatol. 2015;62:S47–S64. doi: 10.1016/j.jhep.2014.12.012. - DOI - PubMed
    1. Cao Y., Deng Y., Wang J., Zhao H., Zhang J., Xie W. The association between NAFLD and risk of chronic kidney disease: A cross-sectional study. Ther. Adv. Chronic. Dis. 2021;12:20406223211048649. doi: 10.1177/20406223211048649. - DOI - PMC - PubMed
    1. Ghazy F., Ebrahimi N., Ebadinejad A., Barzin M., Mahdavi M., Valizadeh M., Azizi F., Hosseinpanah F. Association of obesity severity and duration with incidence of chronic kidney disease. BMC Nephrol. 2024;25:320. doi: 10.1186/s12882-024-03757-x. - DOI - PMC - PubMed
    1. Pacifico L., Bonci E., Andreoli G.M., Di Martino M., Gallozzi A., De Luca E., Chiesa C. The impact of nonalcoholic fatty liver disease on renal function in children with overweight/obesity. Int. J. Mol. Sci. 2016;17:1218. doi: 10.3390/ijms17081218. - DOI - PMC - PubMed

MeSH terms