. 2025 Jun 24;17(13):2117.
doi: 10.3390/cancers17132117.

Immunosuppressive Tumor Microenvironment of Osteosarcoma

Affiliations

Immunosuppressive Tumor Microenvironment of Osteosarcoma

Aaron Michael Taylor et al. Cancers (Basel). .

Abstract

Background/Objectives: Osteosarcoma is the most common malignant bone tumor in children, characterized by a high degree of genomic instability, resulting in copy number alterations and genomic rearrangements without disease-defining recurrent mutations. Clinical trials based on molecular characterization have failed to find new effective therapies or improve outcomes over the last 40 years. Methods: To better understand the immune microenvironment of osteosarcoma, we performed single-cell RNA sequencing on six tumor biopsy samples, combined with a previously published cohort of six samples. Additional osteosarcoma samples were profiled using spatial transcriptomics for the validation of discovered subtypes and to add spatial context. Results: Analysis revealed immunosuppressive cells, including myeloid-derived suppressor cells (MDSCs), regulatory and exhausted T cells, and LAMP3+ dendritic cells. Conclusions: Using cell-cell communication modeling, we identified robust interactions between MDSCs and other cells, leading to NF-κB upregulation and an immunosuppressive microenvironment, as well as interactions involving regulatory T cells and osteosarcoma cells that promoted tumor progression and a proangiogenic niche.

Keywords: immune microenvironment; osteosarcoma; single-cell sequencing; spatial transcriptomics.


Conflict of interest statement

The authors declare no conflicts of interest. The funders had no role in the design of the study; in the collection, analyses, or interpretation of data; in the writing of the manuscript; or in the decision to publish the results.

Figures
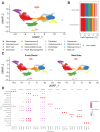
Figure 1
Figure 1
Primary clustering identifies major cell types in pre-treatment osteosarcoma tumors. (A) UMAP visualization of Harmony-corrected principal components, with cell type clusters separated by color. (B) Cell type proportions of each sample cohort. Macrophages and osteosarcoma were the most abundant cell types in both cohorts. (C) UMAP visualization of Harmony-corrected principal components in each cohort. (D) Expression of selected cell-type-specific markers in major cell clusters. Markers were chosen from the differentially expressed genes in Supplementary Table S3 based on fold-change, cell cluster specificity, and their prior published use as cell type markers.
Figure 2
Figure 2
Subclustering of macrophage/DC clusters. (A) UMAP visualization of Harmony-corrected principal components of the macrophage cluster. Cell subtypes separated by color. (B) Expression of selected cell-subtype-specific markers amongst macrophage subclusters. Several subtypes of activated, interferon (IFN)-stimulated, and angiogenic macrophages were identified. (C) UMAP visualization of Harmony-corrected principal components of the proliferative macrophage/DC cluster. Cell subtypes separated by color. (D) Expression of selected cell-subtype-specific markers amongst macrophage/DC subclusters. LYVE+ macrophages were detected, along with populations of cDC1 and cDC2, in addition to a putative LAMP3+ mregDC population.
Figure 3
Figure 3
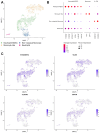
Identification of MDSCs amongst the neutrophil/monocyte population. (A) UMAP visualization of Harmony-corrected principal components of the major neutrophil/monocyte cluster. Cell subtypes separated by color. (B) Dotplot expression of selected markers amongst neutrophil and monocyte subclusters (“N-CM” = non-classical monocyte). (C) Visualization of MDSC feature expression. Seurat’s “AddModuleScore” function was used to create an S100A gene expression score in the leftmost plot. The expression of other MDSC signature genes (VCAN, CLEC4E and CSF3R) is also shown.
Figure 4
Figure 4
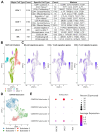
Identification of NK/T cell subtypes using Azimuth. (A) Identified NK/T cells and their subtypes. Cells identified with >0.75 confidence score were mapped to Azimuth’s “L1” identities (‘Major Cell Cluster’) from the reference “PBMC” dataset. Further annotation using the “L2” cell identities (‘Specific Cell Type’) is also shown, along with a subset of the signature genes that define those cell subtypes. (B) UMAP visualization of Harmony-corrected principal components of identified NK/T cell populations, colored by L1 identities. (C) NK cell, CD4+ T cell, and CD8+ T cell scores were created using Seurat’s “AddModuleScore” function from the Azimuth-defined cell type markers. (D) UMAP visualization of Harmony-corrected principal components of identified CD8 T-effector-memory (CD8TEM) cell subpopulations. (E) Dotplot expression of exhaustion markers amongst CD8TEM subpopulations. Exhaustion markers were overexpressed in the largest subcluster of CD8TEMs.
Figure 5
Figure 5
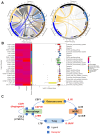
Upregulated ligand–receptor interactions from S2C2, separated by ligand-expressing cell type. (A) (left) A chord diagram from ligand–receptor interaction network between tested cell types. (right) A chord diagram highlighting the interaction originating from myeloid-derived suppressor cells (MDSCs). Width of links are proportional to the number of ligand–receptor interactions identified. (B) Ligand–receptor interactions and downstream pathway expression originating from myeloid-derived suppressor cells (MDSCs). Only identified ligand–receptor interactions with significant enrichment of the downstream pathway are shown. (left) Ligand and receptor expression, annotated by receiver cell type. (right) Boxplot showing the expression of genes in pathways downstream of the ligand–receptor interaction in the receiver cell type, with outliers shown as circles. (C) Summary of the selected interactions between immune cell types and osteosarcoma.
Figure 6
Figure 6
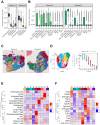
Spatial transcriptomics analysis of osteosarcoma. (A) Estimated fractions of major classes of cell types per spot as determined by deconvolution using RCTD and the single cell reference dataset. The immune class was aggregated from values inferred for 12 subtypes of immune cells. Osteosarcoma, endothelial, and osteoclast were calculated directly. (B) Estimated fractions of 13 immune cell subtypes per spot inferred by deconvolution showed variability between patients. (C) H&E images overlayed with spot cluster membership determined by unsupervised clustering of gene expression defining regional patterning. (D) Cluster membership information depicted as a UMAP plot (left) and as a percent of total spots for each patient (right). (E) Heatmap with z-scores based on the median cell type fraction per cluster. (F) Heatmap with z-scores based on the median PROGENy scores per cluster. These scores of relative pathway activity based on weighted gene expression levels were calculated per spot. Asterisks indicate the adjusted significance level for enrichment determined by one-sided Wilcoxon rank sum test. Spots in a single cluster were compared to all other spots. *, p < 0.05; **, p < 0.01; ***, p < 0.001.

References

    1. Meltzer P.S., Helman L.J., Longo D.L. New Horizons in the Treatment of Osteosarcoma. N. Engl. J. Med. 2021;385:2066–2076. doi: 10.1056/NEJMra2103423. - DOI - PubMed
    1. Chen X., Bahrami A., Pappo A., Easton J., Dalton J., Hedlund E., Ellison D., Shurtleff S., Wu G., Wei L., et al. Recurrent Somatic Structural Variations Contribute to Tumorigenesis in Pediatric Osteosarcoma. Cell Rep. 2014;7:104–112. doi: 10.1016/j.celrep.2014.03.003. - DOI - PMC - PubMed
    1. Koirala P., Roth M.E., Gill J., Piperdi S., Chinai J.M., Geller D.S., Hoang B.H., Park A., Fremed M.A., Zang X., et al. Immune Infiltration and Pd-L1 Expression in the Tumor Microenvironment Are Prognostic in Osteosarcoma. Sci. Rep. 2016;6:30093. doi: 10.1038/srep30093. - DOI - PMC - PubMed
    1. Lussier D.M., Johnson J.L., Hingorani P., Blattman J.N. Combination Immunotherapy with A-Ctla-4 and A-Pd-L1 Antibody Blockade Prevents Immune Escape and Leads to Complete Control of Metastatic Osteosarcoma. J. Immunother. Cancer. 2015;3:21. doi: 10.1186/s40425-015-0067-z. - DOI - PMC - PubMed
    1. D’Angelo S.P., Mahoney M.R., Van Tine B.A., Atkins J., Milhem M.M., Jahagirdar B.N., Antonescu C.R., Horvath E., Tap W.D., Schwartz G.K., et al. Nivolumab with or without Ipilimumab Treatment for Metastatic Sarcoma (Alliance A091401): Two Open-Label, Non-Comparative, Randomised, Phase 2 Trials. Lancet Oncol. 2018;19:416–426. doi: 10.1016/S1470-2045(18)30006-8. - DOI - PMC - PubMed

LinkOut - more resources