. 2025 Jul 4;17(13):2246.
doi: 10.3390/cancers17132246.

Oncogenic Activity and Sorafenib Sensitivity of ARAF p.S214C Mutation in Lung Cancer

Affiliations

Oncogenic Activity and Sorafenib Sensitivity of ARAF p.S214C Mutation in Lung Cancer

Carol Lee et al. Cancers (Basel). .

Abstract

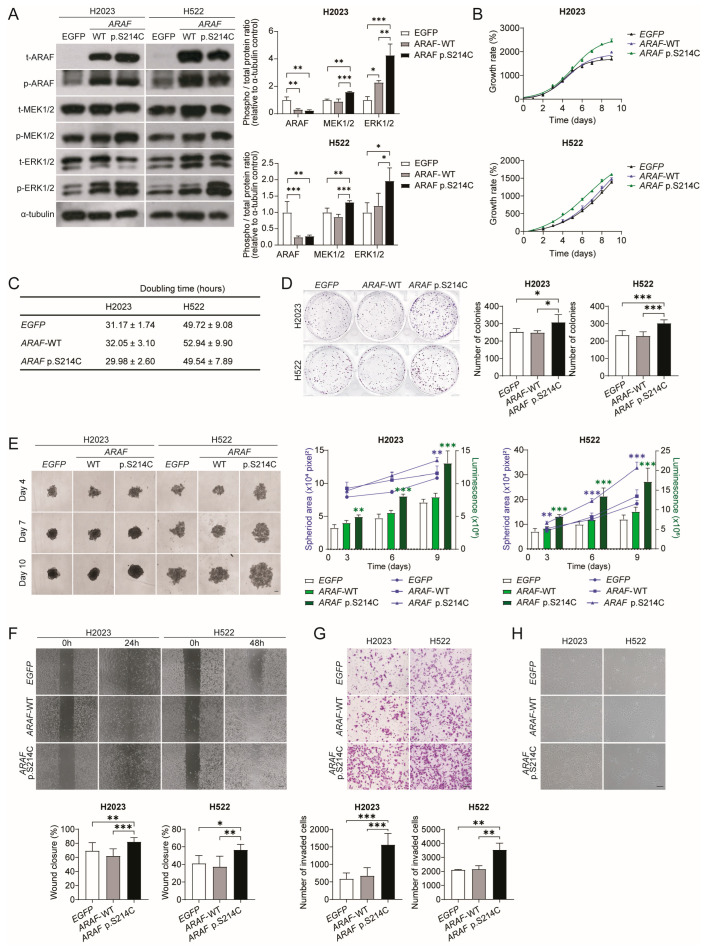
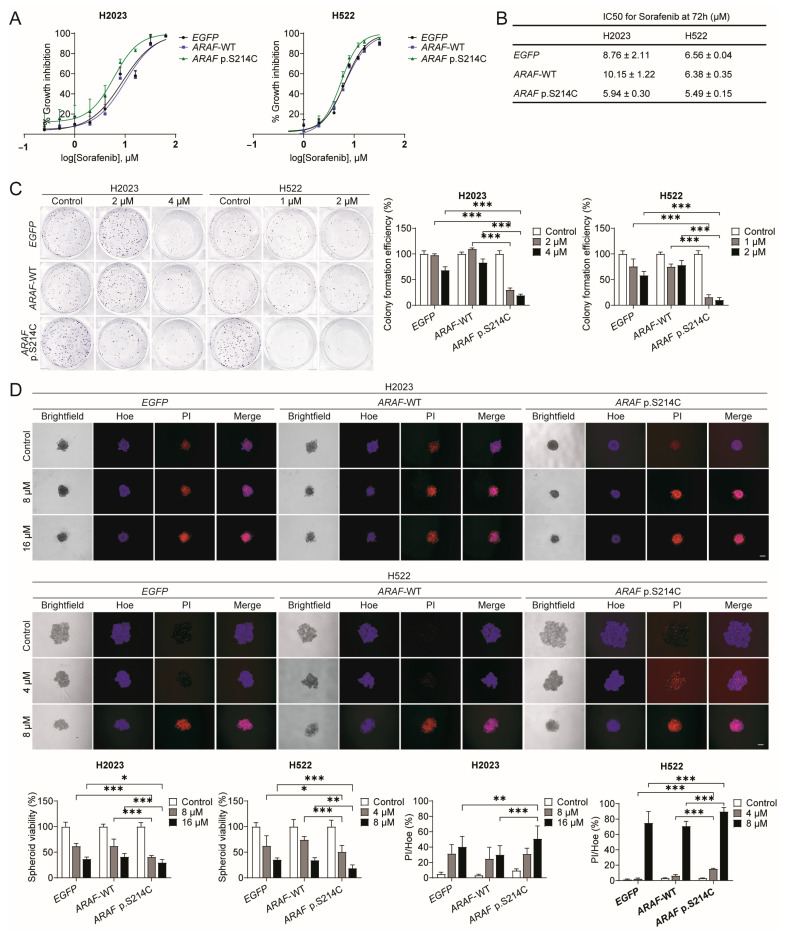
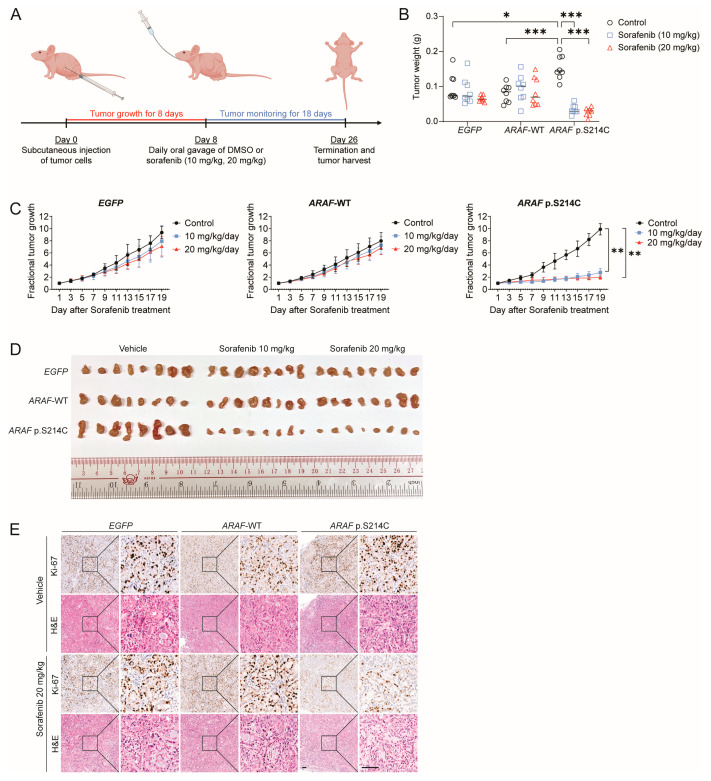
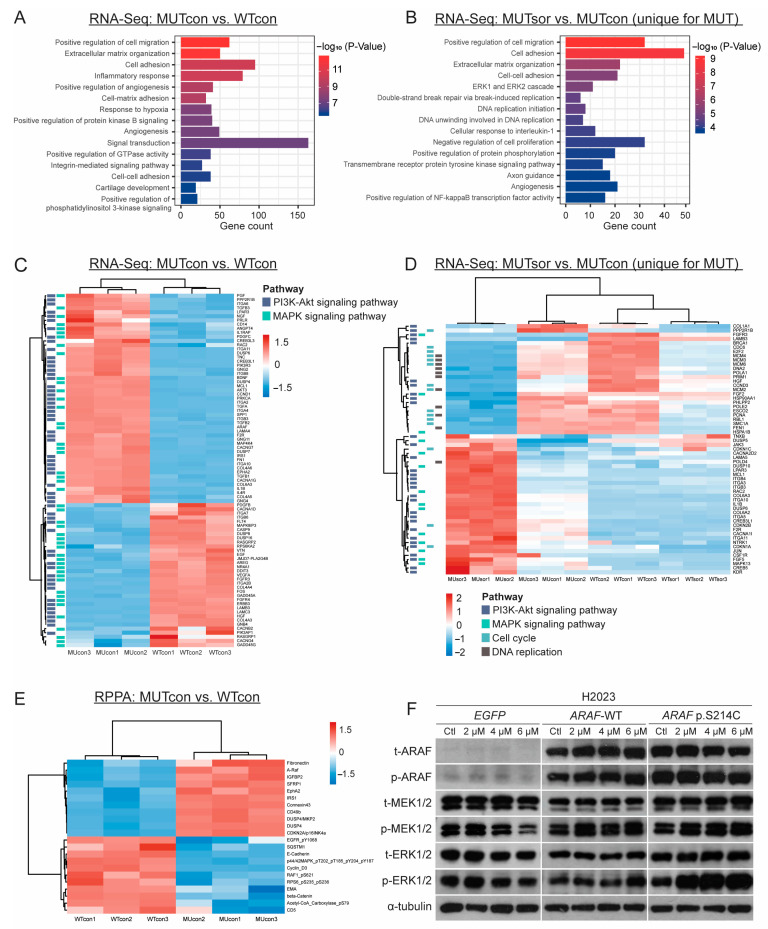
Background/Objectives: RAF pathway aberrations are one of the hallmarks of lung cancer. Sorafenib is a multi-kinase inhibitor targeting the RAF pathway and is FDA-approved for several cancers, yet its efficacy in lung cancer is controversial. Previous clinical research showed that a ARAF p.S214C mutation exhibited exceptional responsiveness to sorafenib in lung adenocarcinoma. Methods: Considering this promising clinical potential, the oncogenic potential and sorafenib response of the ARAF p.S214C mutation were investigated using lung cancer models. ARAF p.S214C mutant, ARAF wild-type (WT), and EGFP control genes were ectopically expressed in lung adenocarcinoma cell lines retroviral transduction. In vitro and in vivo sorafenib sensitivity studies were performed, followed by transcriptomics and proteomics analyses. Results: Compared to the ARAF-WT and EGFP-engineered cells, the ARAF p.S214C-engineered cells activated Raf-MEK-ERK signaling and exhibited enhanced oncogenic potential in terms of in vitro cell proliferation, colony and spheroid formation, migration, and invasion abilities, as well as in vivo tumorigenicity. The ARAF p.S214C-engineered cells also displayed heightened sensitivity to sorafenib in vitro and in vivo. RNA sequencing and reverse-phase protein array analyses demonstrated elevated expression of genes and proteins associated with tumor aggressiveness in the ARAF p.S214C mutants, and its sorafenib sensitivity was likely moderated through inhibition of the cell cycle and DNA replication. The ERK and PI3K signaling pathways were also significantly deregulated in the ARAF p.S214C mutants regardless of sorafenib treatment. Conclusions: This study demonstrates the oncogenicity and sorafenib sensitivity of the ARAF p.S214C mutation in lung cancer cells, which may serve as a biomarker for predicting the sorafenib response in lung cancer patients. Importantly, investigating the gene-drug sensitivity pairs in clinically exceptional responders may guide and accelerate personalized cancer therapies based on specific tumor mutations.

Keywords: ARAF p.S214C mutation; lung cancer; oncogenicity; sorafenib sensitivity.


Conflict of interest statement

The authors declare no conflicts of interest.

Figures

Figure 1
Figure 1
The ARAF mutation landscape in cancer. (A) The number and frequency of ARAF mutations in different cancer types in AACR Project GENIE public database cohort v14.1. (B) Lung cancer cases with ARAF p.S214C mutations in the GENIE public database cohort v14.1. All cases are adenocarcinoma. (C) Mapping of the ARAF mutation sites based on the pan-cancer data from GENIE database v14.1. Each mutation case is shown as one triangular symbol. Each cancer type is color-coded as shown. C1, phorbol ester/diacylglycerol-binding domain. RBD, Ras-binding domain.
Figure 2
Figure 2
ARAF p.S214C activates the MEK/ERK pathway and enhances oncogenicity. (A) Western blot showing the expression levels of total (t)-ARAF, phospho-(p)-ARAF, t-MEK1/2, p-MEK1/2, t-ERK1/2, and p-ERK1/2 in H2023 and H522 cells ectopically expressing EGFP, ARAF-WT, and ARAF p.S214C, respectively (denoted as sublines below). α-tubulin was included as a loading control. Densitometric quantification of the phosphorylated and total expression of ARAF, MEK1/2, and ERK1/2 is shown in bar graphs. (B) The growth rate and (C) the doubling time of the H2023 and H522 sublines assessed through the MTT assay (H2023, p = 0.0144; H522, p = 0.0014). (D) Colony formation of H2023 (1000 cells/well) and H522 (1000 cells/well) sublines for 7 and 14 days, respectively (H2023, p = 0.016; H522, p < 0.001). The number of colonies with a diameter of over 250 µm was quantified using ImageJ. (E) Spheroid growth of the H2023 (1000 cells/well) and H522 (5000 cells/well) sublines on days 4, 7, and 10 in terms of the spheroid area measured using ImageJ (H2023, p = 0.0040; H522, p < 0.001) and the spheroid cell viability determined through the luminescence signal in the CellTiter-Glo 3D Cell Viability assay (H2023, p < 0.001; H522, p < 0.001). Scale bar, 200 μm. (F) The migration of the H2023 (4 × 10⁴ cells/insert) and H522 (5 × 10⁴ cells/insert) sublines for 24 h and 48 h, respectively, determined by the area of gap closure (H2023, p < 0.001; H522, p = 0.005). Scale bar, 200 μm. (G) The invasion of the H2023 (4 × 10⁴ cells/well) and H522 (5 × 10⁴ cells/well) sublines over 18 h and 48 h, respectively, assessed through the Transwell assay (H2023, p < 0.001; H522, p = 0.004). Invasive cells were stained using crystal violet, and 10 random fields of view were quantified at 100× magnification per well. Scale bar, 200 μm. (H) Representative phase-contrast images of the H2023 and H522 sublines. Scale bar, 200 μm. The data in (AG) were obtained from n ≥ 3 independent experiments. Statistical differences were calculated through a one-way ANOVA followed by Tukey’s multiple comparison test (* p < 0.05, ** p < 0.01, *** p < 0.001). For clarity, the p-values reported in the text only compare wild-type and mutant groups. The original Western blot figures can be found in Supplementary Materials.
Figure 3
Figure 3
ARAF p.S214C mutant cells show sensitivity to sorafenib in vitro. (A) Dose–response curves and (B) half-maximal inhibitory concentrations (IC50) for sorafenib at 72 h in H2023 (3000 cells/well) and H522 cells (6000 cells/well) ectopically expressing EGFP, ARAF-WT, and ARAF p.S214C, denoted as sublines below (IC50 values: H2023, p = 0.0237; H522, p = 0.0064). (C) The colony formation efficiency of H2023 (1000 cells/well, 7 days) and H522 (1000 cells/well, 14 days) sublines following treatment with DMSO control or sorafenib at different doses (H2023: p < 0.001; H522: p < 0.001). (D) Spheroid formation efficiency of H2023 and H522 (both 1000 cells/well, 4 days of spheroid growth) sublines following treatment with DMSO control or sorafenib for 72 h. Spheroids were stained with Hoechst 33342 and propidium iodide. The apoptotic subpopulation in the spheroids is presented as the ratio of PI+ cells, representing apoptotic cells, to Hoe+ cells, representing the total cell count (H2023: p < 0.001; H522: p < 0.001). Spheroid viability was determined according to the luminescence signal in the CellTiter-Glo 3D Cell Viability assay (H2023: p < 0.001; H522: p = 0.001). Scale bar, 200 μm. The data in (AD) were obtained from n ≥ 3 independent experiments. The statistical difference was calculated through a one-way ANOVA followed by Tukey’s multiple comparison test (* p < 0.05, ** p < 0.01, *** p < 0.001). For clarity, the p-values reported in the text only compare wild-type and mutant groups.
Figure 4
Figure 4
ARAF p.S214C mutant cells show sensitivity to sorafenib in vivo. (A) The dosing schedule for sorafenib treatment of the mice. H2023 cells expressing EGFP, ARAF-WT, and ARAF p.S214C were subcutaneously inoculated into 4- to 6-week-old male Nu/J mice, respectively (2 × 10⁶ cells per inoculation). Mice with the respective xenografts were treated with sorafenib (10 mg/kg or 20 mg/kg) or cremophor EL/95% ethanol (as the vehicle) daily via oral gavage for 18 days. Each group comprised 4 mice, with each bearing 2 tumors (n = 8 tumors per group). (B) Column scatter plots showing the individual tumor volumes at the end of the experiment (p.S214C control vs. WT control, p < 0.001; p.S214C control vs. p.S214C sorafenib, p < 0.001). Horizontal lines indicate the mean tumor weight. (C) The fractional tumor growth curves for the mice xenografts expressing EGFP, ARAF-WT, and ARAF p.S214C upon sorafenib or DMSO vehicle treatment for 18 days (20 mg/kg sorafenib, p.S214C vs. WT, p = 0.003). (D) Images of the tumors at the experimental endpoint. (E) Representative images of immunohistochemistry staining of the proliferation marker Ki-67 and H&E staining of the xenografts upon the sorafenib (20 mg/kg) or vehicle treatment. 100× and 400×; scale bar, 100 μm. The statistical difference was calculated through a one-way ANOVA followed by Tukey’s multiple comparison test (* p < 0.05, ** p < 0.01, *** p < 0.001). For clarity, the p-values reported in the text only compare the wild-type and mutant groups.
Figure 5
Figure 5
Transcriptomic and proteomic analyses of ARAF-WT and ARAF p.S214C mutant cells with or without sorafenib treatment. RNA-Seq and RPPA were performed for H2023 cells expressing ARAF-WT and ARAF p.S214C treated with vehicle control or 4 µM of sorafenib for 72 h. Three replicates were used per group. (A) Bar plot of top 15 enriched GO BP terms for DEGs between ARAF-WT and ARAF p.S214C cells, ranked in order of significance based on p-values. (B) Heatmap displaying DEGs within selected pathways of interest between ARAF-WT and ARAF p.S214C cells without sorafenib treatment. (C) Bar plot of top 15 enriched GO BP terms for unique DEGs between ARAF-WT and ARAF p.S214C cells with and without sorafenib treatment, ranked in order of significance based on p-values. (D) Heatmap of ARAF p.S214C-mutant-specific DEGs in specified enriched pathways in response to sorafenib treatment. (E) Heatmap presenting the differential protein expression patterns identified from the RPPA analysis between the ARAF-WT and ARAF p.S214C cells without sorafenib treatment. (F) The Western blot analysis showing the expression levels of t-ARAF, p-ARAF, t-MEK1/2, p-MEK1/2, t-ERK1/2, and p-ERK1/2 in H2023 cells ectopically expressing EGFP, ARAF-WT, and ARAF p.S214C upon sorafenib treatment. α-tubulin was included as a loading control. The original Western blot figures can be found in Supplementary Materials.

Similar articles

References

    1. Bray F., Laversanne M., Sung H., Ferlay J., Siegel R.L., Soerjomataram I., Jemal A. Global cancer statistics 2022: GLOBOCAN estimates of incidence and mortality worldwide for 36 cancers in 185 countries. CA Cancer J. Clin. 2024;74:229–263. doi: 10.3322/caac.21834. - DOI - PubMed
    1. Chevallier M., Borgeaud M., Addeo A., Friedlaender A. Oncogenic driver mutations in non-small cell lung cancer: Past, present and future. World J. Clin. Oncol. 2021;12:217–237. doi: 10.5306/wjco.v12.i4.217. - DOI - PMC - PubMed
    1. Zhu C., Guan X., Zhang X., Luan X., Song Z., Cheng X., Zhang W., Qin J.-J. Targeting KRAS mutant cancers: From druggable therapy to drug resistance. Mol. Cancer. 2022;21:159. doi: 10.1186/s12943-022-01629-2. - DOI - PMC - PubMed
    1. Jeon H., Tkacik E., Eck M.J. Signaling from RAS to RAF: The molecules and their mechanisms. Ann. Rev. Biochem. 2024;93:289–316. doi: 10.1146/annurev-biochem-052521-040754. - DOI - PubMed
    1. Ullah R., Yin Q., Snell A.H., Wan L. Raf-MEK-ERK pathway in cancer evolution and treatment. Semin. Cancer Biol. 2022;85:123–154. doi: 10.1016/j.semcancer.2021.05.010. - DOI - PubMed

LinkOut - more resources