. 2025 Jun 26;15(13):1628.
doi: 10.3390/diagnostics15131628.

A Hybrid Ensemble Learning Framework for Predicting Lumbar Disc Herniation Recurrence: Integrating Supervised Models, Anomaly Detection, and Threshold Optimization

Affiliations

A Hybrid Ensemble Learning Framework for Predicting Lumbar Disc Herniation Recurrence: Integrating Supervised Models, Anomaly Detection, and Threshold Optimization

Mădălina Duceac Covrig et al. Diagnostics (Basel). .

Abstract

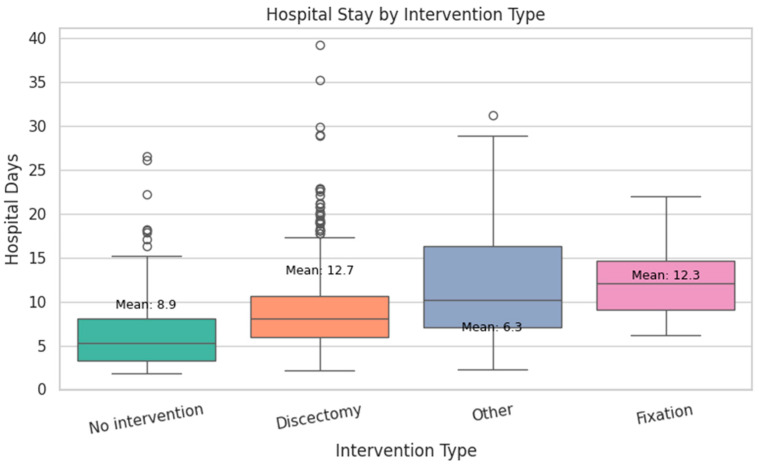
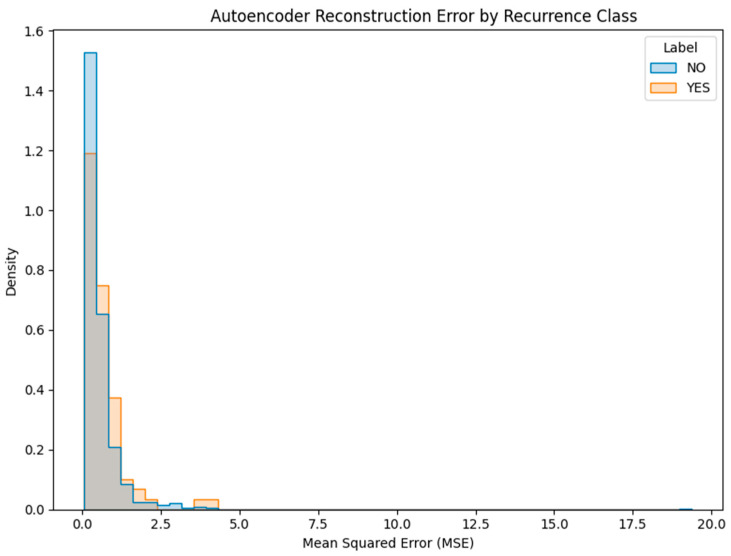
Background: Lumbar disc herniation (LDH) recurrence remains a pressing clinical challenge, with limited predictive tools available to support early identification and personalized intervention. Predicting recurrence after lumbar disc herniation (LDH) remains clinically important but algorithmically difficult due to extreme class imbalance and low signal-to-noise ratio. Objective: This study proposes a hybrid machine learning framework that integrates supervised classifiers, unsupervised anomaly detection, and decision threshold tuning to predict LDH recurrence using routine clinical data. Methods: A dataset of 977 patients from a Romanian neurosurgical center was used. We trained a deep neural network, random forest, and an autoencoder (trained only on non-recurrence cases) to model baseline and anomalous patterns. Their outputs were stacked into a meta-classifier and optimized via sensitivity-focused threshold tuning. Evaluation was performed via stratified cross-validation and external holdout testing. Results: Baseline models achieved high accuracy but failed to recall recurrence cases (0% sensitivity). The proposed ensemble reached 100% recall internally with a threshold of 0.05. Key predictors included hospital stay duration, L4-L5 herniation, obesity, and hypertension. However, external holdout performance dropped to 0% recall, revealing poor generalization. Conclusions: The ensemble approach enhances detection of rare recurrence cases under internal validation but exhibits poor external performance, emphasizing the challenge of rare-event modeling in clinical datasets. Future work should prioritize external validation, longitudinal modeling, and interpretability to ensure clinical adoption.

Keywords: autoencoder; class imbalance; clinical decision support; ensemble learning; lumbar disc herniation; machine learning; recovery/rehabilitation; recurrence prediction; threshold tuning.


Conflict of interest statement

The authors declare no conflicts of interest.

Figures

Figure 1
Figure 1
Distribution of Sex and Environment. M = Male; F = Female; U = Urban; R = Rural.
Figure 2
Figure 2
Age distribution of patients. The histogram displays the number of patients within each age bin, while the overlaid line represents a kernel density estimate (KDE), illustrating the smoothed distribution trend.
Figure 3
Figure 3
Hospital Stay Distribution.
Figure 4
Figure 4
Intervention Type Distribution.
Figure 5
Figure 5
Hospital stay duration by intervention type. The boxplots show the distribution of hospital days for each intervention category, with the mean values annotated. Circles represent outliers, defined as observations lying beyond 1.5 times the interquartile range (IQR) from the box edges.
Figure 6
Figure 6
Functional Outcome Distribution.
Figure 7
Figure 7
Postoperative Control Follow-up.
Figure 8
Figure 8
Rehabilitation Status.
Figure 9
Figure 9
Number of Herniated Levels. Distribution of patients based on the number of lumbar disc herniation levels: 0 = likely corresponds to patients without confirmed imaging evidence of herniation, early clinical resolution, or documentation artifacts, 1 = single-level herniation, 2 = two-level, 3 = three-level involvement.
Figure 10
Figure 10
Anatomical Distribution of Herniation.
Figure 11
Figure 11
Recurrence Type Distribution.
Figure 12
Figure 12
Distribution of Neurological Deficits.
Figure 13
Figure 13
Prevalence of Comorbidities.
Figure 14
Figure 14
Statistically significant clinical variables associated with recurrence or functional recovery. Chi-square, Kruskal–Wallis, and Spearman correlation tests were used based on variable type. A p-value threshold of 0.05 was applied (dashed line).
Figure 15
Figure 15
Distribution of hospital stay duration in patients with and without recurrence (Recurrence: 0 = No, 1 = Yes). A slight increase in median and variability is noted among patients who experienced recurrence. This association was statistically significant via point-biserial correlation (p = 0.009). Diamond symbols represent statistical outliers, defined as values exceeding 1.5 times the interquartile range from the box edges.
Figure 16
Figure 16
Workflow diagram showing the end-to-end pipeline: preprocessing → model training → autoencoder anomaly scoring → ensemble stacking → threshold tuning → evaluation.
Figure 17
Figure 17
KDE Distributions of Top Predictive Features by Recurrence ClassEach subplot compares the distribution of a clinical variable between patients with (YES, red) and without (NO, blue) recurrence. Variables include INTERVENTION_TYPE, HOSPITAL_DAYS, NUMBER_OF_HERNIA_LEVELS, L4_L5, and AGE. Slight distribution shifts suggest modest discriminative power.
Figure 18
Figure 18
Confusion Matrix–Isolation Forest Predictions This matrix summarizes predictions made by the Isolation Forest. Although some recurrence (YES) cases are detected, many are missed and several non-recurrence (NO) cases are incorrectly flagged.
Figure 19
Figure 19
Autoencoder Reconstruction Error by Recurrence Class. This histogram compares the mean squared reconstruction error (MSE) produced by the autoencoder between patients with recurrence (YES) and without (NO). Most NO cases cluster tightly near zero, while a subset of YES cases demonstrates notably higher reconstruction error, suggesting detectable deviations from learned patterns of normal (non-recurrence) profiles. The grey regions indicate areas where the reconstruction error distributions for recurrence (YES) and non-recurrence (NO) patients overlap, reflecting shared error ranges across both classes.
Figure 20
Figure 20
Architecture of the Stacked Ensemble Model This diagram depicts the ensemble pipeline: structured features are passed to a deep learning classifier and a random forest classifier, while a deep autoencoder provides anomaly scores. The outputs from these models are stacked into a feature vector used to train a final random forest meta-classifier.
Figure 21
Figure 21
Meta-Ensemble Performance versus Threshold Precision, recall, and F1 score curves are plotted across threshold values. Lower thresholds increase recall at the cost of precision, enabling sensitivity tuning for clinical applications where missing a recurrence is costly. This analysis supports the use of a flexible thresholding strategy in practice, enabling clinicians to prioritize sensitivity depending on the use-case and risk tolerance.
Figure 22
Figure 22
Confusion Matrices for 5-Fold Cross-Validation Each panel represents a fold’s confusion matrix with actual vs. predicted recurrence labels. The model demonstrates strong sensitivity and low false-negative rates for recurrence prediction across all folds.
Figure 23
Figure 23
Prediction Scores for Synthetic High-Risk Profiles Bar plot showing recurrence probabilities for five synthetic patients constructed from known risk features (e.g., long hospital stay, obesity, L4–L5 hernia). All predictions exceed the decision threshold of 0.05, indicating successful classification of high-risk cases.
Figure 24
Figure 24
Distribution of Predicted Probabilities for All Real YES Cases Histogram of predicted recurrence probabilities assigned to real YES patients. The majority of probabilities cluster above 0.90, far exceeding the tuned threshold of 0.05 (indicated in red), highlighting the model’s confidence in recurrence detection.
Figure 25
Figure 25
Mean Predicted Probability for Real YES Cases by Comorbidity. Bar chart of average predicted probabilities for YES patients grouped by comorbidity. Hypertension and cardiovascular disease were most frequently associated with high prediction scores, reinforcing the model’s ability to capture clinically relevant risk signals.
Figure 26
Figure 26
Top 15 Feature Importances from Random Forest. This bar chart visualizes the 15 most influential features for recurrence classification. Procedural and demographic markers such as hospital stay duration and age dominate the top ranks.
Figure 27
Figure 27
Top 15 Feature Importances from XGBoost (Recurrence Prediction). Unlike the Random Forest model, XGBoost highlights neurological and systemic variables such as paresis, diabetes, and comorbid conditions as key predictors.
Figure 28
Figure 28
(left) PCA projection of the feature space onto the first two principal components (left panel), with each point colored by recurrence status (red = YES, blue = NO). The extensive overlap between red and blue points indicates poor linear separability of recurrence outcomes. (right) t-SNE 2D embedding of the patient feature space (right panel), colored by recurrence status (red = YES, blue = NO). While a few small clusters of recurrence cases are visible (red points in close proximity), the majority of YES cases are interspersed among NO cases, reflecting low overall class separability.
Figure 29
Figure 29
Permutation Feature Importance of Meta-Ensemble Inputs. This plot displays the performance degradation in the meta-classifier when each input feature is randomly shuffled. The random forest and deep learning probabilities dominate, but the anomaly signal (AE_MSE) also contributes additional value.
Figure 30
Figure 30
Correlation Matrix of Base Model Outputs (DL_Prob, RF_Prob, AE_MSE). Pearson correlation heatmap showing relationships between the base features used in the meta-classifier. While DL_Prob and RF_Prob are strongly aligned, AE_MSE contributes decorrelated information that enhances ensemble sensitivity.
Figure 31
Figure 31
Confusion matrices for deep learning, random forest, and autoencoder models evaluated on the external hold-out set (n = 196). The deep learning model correctly classified 180 of 181 NO cases but failed to detect any recurrence (0/15). The random forest classifier achieved perfect specificity (181/181) but also failed to identify any YES case. In contrast, the autoencoder—using an anomaly threshold of 1.0661 (mean + std of training MSE)—detected 2 out of 15 recurrence cases, at the cost of 22 false positives. These matrices illustrate the extreme class imbalance and motivate the ensemble strategy adopted in this study.

Similar articles

Cited by

References

    1. Jordan J., Konstantinou K., O’Dowd J. Herniated lumbar disc. BMJ Clin. Evid. 2009;2009:1118. - PMC - PubMed
    1. Fjeld O.R., Grøvle L., Helgeland J., Småstuen M.C., Solberg T.K., Zwart J.A., Grotle M. Complications, reoperations, readmissions, and length of hospital stay in 34 639 surgical cases of lumbardisc herniation. Bone Joint J. 2019;101:470–477. doi: 10.1302/0301-620X.101B4.BJJ-2018-1184.R1. - DOI - PubMed
    1. Murray C.J., Barber R.M., Foreman K.J., Ozgoren A.A., Abd-Allah S.F., Abera S.F., Aboyans V., Abraham J.P., Abubakar I., Abu-Raddad L.J., et al. Global, regional, and national disability-adjustedlife years (DALYs) for 306 diseases and injuries and healthy lifeexpectancy (HALE) for 188 countries, 1990–2013: Quantifyingthe epidemiological transition. Lancet. 2015;386:2145–2191. doi: 10.1016/S0140-6736(15)61340-X. - DOI - PMC - PubMed
    1. Kim J.-H., van Rijn R.M., van Tulder M.W., Koes B.W., de Boer M.R., Ginai A.Z., Ostelo R.W.G.J., van der Windt D.A.M.W., Verhagen A.P. Diagnostic accuracy of diagnostic imaging for lumbar disc herniation in adults with low back pain or sciatica is unknown; a systematic review. Chiropr. Man. Ther. 2018;26 doi: 10.1186/s12998-018-0207-x. - DOI - PMC - PubMed
    1. Shimia M., Babaei-Ghazani A., Sadat B., Habibi B., Habibzadeh A., Be S. Risk factors of recurrent lumbar disk herniation. Asian J. Neurosurg. 2013;8:93–96. doi: 10.4103/1793-5482.116384. - DOI - PMC - PubMed

LinkOut - more resources