Review
. 2025 Jul 2;15(13):1688.
doi: 10.3390/diagnostics15131688.

Blue Light and Green Light Fundus Autofluorescence, Complementary to Optical Coherence Tomography, in Age-Related Macular Degeneration Evaluation

Affiliations
Review

Blue Light and Green Light Fundus Autofluorescence, Complementary to Optical Coherence Tomography, in Age-Related Macular Degeneration Evaluation

Antonia-Elena Ranetti et al. Diagnostics (Basel). .

Abstract

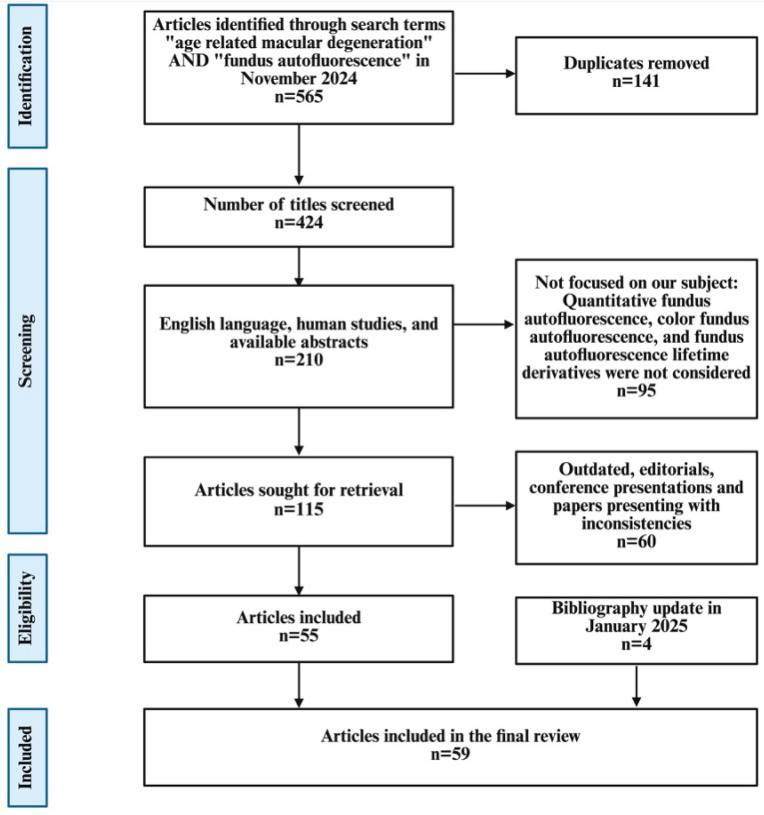
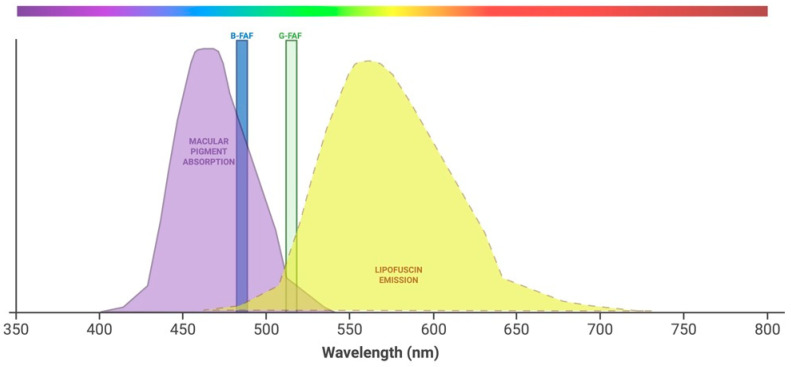
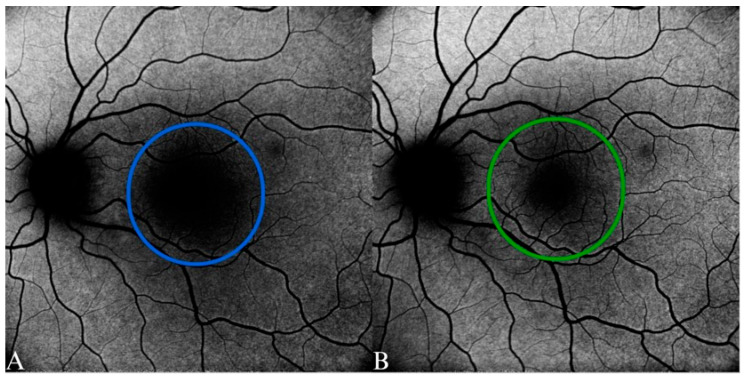
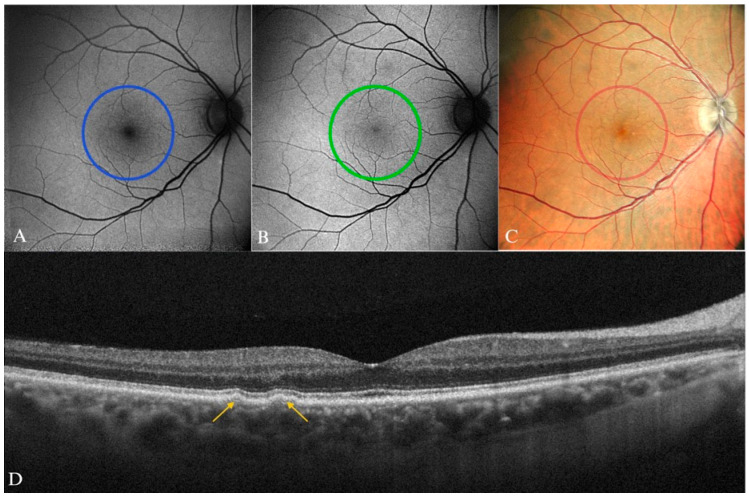
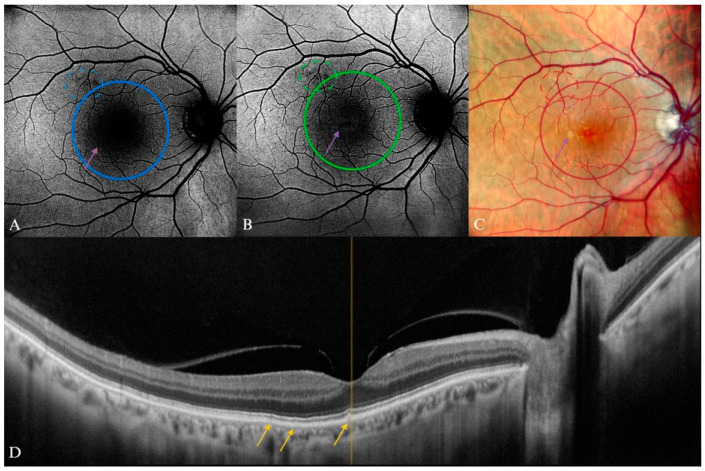
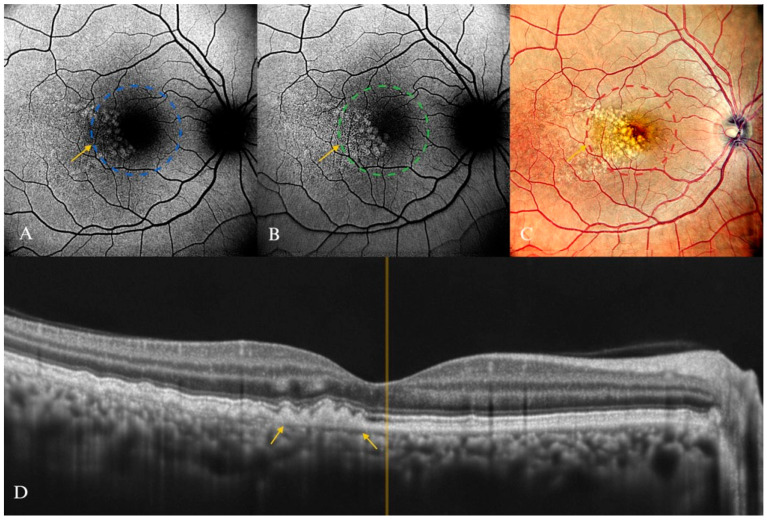
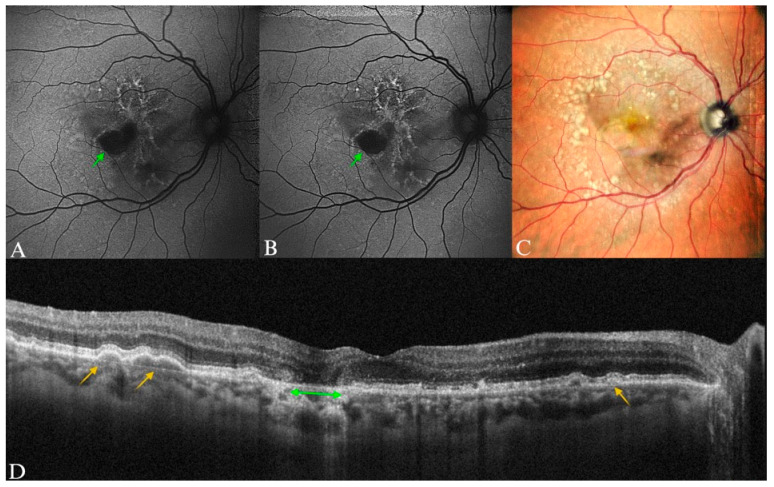
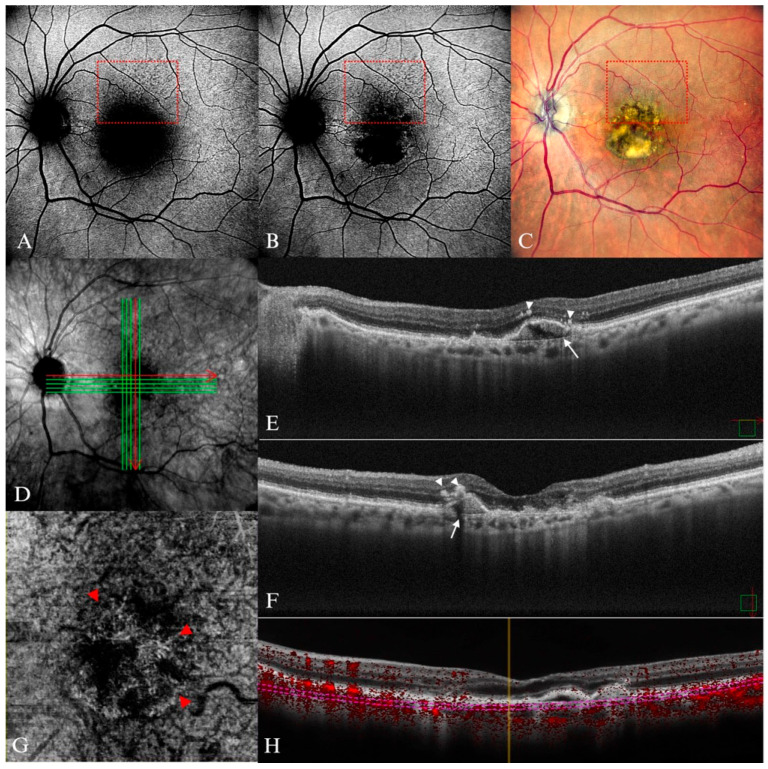
Background: Age-related macular degeneration (AMD) is one of the leading causes of permanent vision loss in the elderly, particularly in higher-income countries. Fundus autofluorescence (FAF) imaging is a widely used, non-invasive technique that complements structural imaging in the assessment of retinal pigment epithelium (RPE) integrity. While optical coherence tomography (OCT) remains the gold standard for retinal imaging due to its high-resolution cross-sectional visualization, FAF offers unique metabolic insights. Among the FAF modalities, blue light FAF (B-FAF) is more commonly employed, whereas green light FAF (G-FAF) provides subtly different image characteristics, particularly improved visualization and contrast in the central macula. Despite identical acquisition times and nearly indistinguishable workflows, G-FAF is notably underutilized in clinical practice. Objectives: This narrative review critically compares green and blue FAF in terms of their diagnostic utility relative to OCT, with a focus on lesion detectability, macular pigment interference, and clinical decision-making in retinal disorders. Methods: A comprehensive literature search was performed using the PubMed database for studies published prior to February 2025. The search utilized the keywords fundus autofluorescence and age-related macular degeneration. The primary focus was on short-wavelength FAF and its clinical utility in AMD, considering three aspects: diagnosis, follow-up, and prognosis. The OCT findings served as the reference standard for anatomical correlation and diagnostic accuracy. Results: Both FAF modalities correlated well with OCT in detecting RPE abnormalities. G-FAF demonstrated improved visibility of central lesions due to reduced masking by macular pigment and enhanced contrast in the macula. However, clinical preference remained skewed toward B-FAF, driven more by tradition and device default settings than by evidence-based superiority. G-FAF's diagnostic potential remains underrecognized despite its comparable practicality and subtle imaging advantages specifically for AMD patients. AMD stages were accurately characterized, and relevant images were used to highlight the significance of G-FAF and B-FAF in the examination of AMD patients. Conclusions: While OCT remains the gold standard, FAF provides complementary information that can guide management strategy. Since G-FAF is functionally equivalent in acquisition, it offers slight advantages. Broader awareness and more frequent integration of G-FAF that could optimize multimodal imaging strategies, particularly in the intermediate stage, should be developed.

Keywords: age-related macular degeneration; fundus autofluorescence; multimodal imaging; optical coherence tomography; retinal pigment epithelium; scanning laser ophthalmoscope.


Conflict of interest statement

The authors declare no conflicts of interest.

Figures

Figure 1
Figure 1
Flow diagram showing the article selection process. Note: The literature search covered studies published between 1995 and 2025 to capture both the early development and evolution of FAF imaging in AMD.
Figure 2
Figure 2
Simplified retinoid cycle. When exposed to light, 11-cis-retinal inside the photoreceptor attached to rhodopsin transforms into all-trans-retinal. Most of the all-trans-retinal is converted to all-trans-retinol and delivered to the RPE, where it is transformed again into 11-cis-retinal, which is returned to the outer segment of the photoreceptor. Excess all-trans-retinal combines with PE, and forms N-Ret-PE. All-trans-retinal binds with N-Ret-PE to form an intermediate compound, and it will be phagocytosed by the RPE. Inside the RPE, A2E, which is derived from the second compound, will accumulate and induce damage to the RPE. PE = phosphatidylethanolamine; N-Ret-PE = N-retinylidene-PE; A2E = N-retinyl-N-retinylidene ethanolamine, a lipofuscin component. Created in BioRender [29].
Figure 3
Figure 3
Granules of melanin, lipofuscin, and melanolipofuscin inside the RPE cells. Created in BioRender [31].
Figure 4
Figure 4
Spectral characteristics of B-FAF, G-FAF, and retinal fluorophores. Created in BioRender [56].
Figure 5
Figure 5
Fundus autofluorescence of normal fovea in a 38-year-old female patient. (A) Blue-FAF. (B) Green-FAF. The FAF signal was significantly reduced in A compared with B; the larger hypoautofluorescence area was due to higher absorption by the macular pigments.
Figure 6
Figure 6
Early AMD in a 65-year-old male patient. (A) B-FAF and (B) G-FAF—with normal aspect in a patient with small- and medium-size drusen, which was barely visible on the (C) color SLO imaging (cSLO). (D) Yellow arrows indicating the lesions well-delineated on SD-OCT.
Figure 7
Figure 7
Early AMD in a 78-year-old male patient. (A) B-FAF and (B) G-FAF displaying “minimal change” pattern in the FAF imaging, which were more visible on (B) G-FAF, minimal alteration of the fundus autofluorescence; (C) purple arrow pointing to corresponding drusen on cSLO. (D) Yellow arrows showing the drusenoid lesions on SD-OCT. Apart from the visible drusen, vitreomacular adhesion syndrome is also present in this image.
Figure 8
Figure 8
Intermediate AMD in a 74-year-old female patient. (A) B-FAF of multiple hyperautofluorescent round areas indicated by the yellow arrow, revealing a “patchy pattern” (inside the dashed circle). (B) In G-FAF, the luteal pigment had less impact, and thus the hyperautofluorescent round lesions were more clearly delineated, indicated by the yellow arrow (inside the dashed circle). (C) cSLO multiple soft drusen lesions (mostly visible inside the dashed circle). (D) SD-OCT displaying the corresponding aspect (yellow arrows).
Figure 9
Figure 9
Subretinal drusenoid deposits in an 82-year-old female patient. (A) B-FAF and (B) G-FAF displaying the “reticular” pattern in the superior macula (in the pink dotted rectangle) as multiple small hypoautofluorescent dots. (C) Multiple drusenoid yellow lesions inside the pink dotted rectangle on cSLO. (D) En-face image displaying the location (the blue line inside the pink dotted rectangle) of the section in (E). Pink arrows point toward the SDD on SD-OCT.
Figure 10
Figure 10
Pigmentary abnormalities in an 84-year old male patient, which reflect in (A) B-FAF, where the purple arrow points toward three visible lines forming a “linear pattern” of intense hyperautofluorescence. (B) In G-FAF, the hyperautofluorescent lesion line that passes through the foveal region is significantly more intense, with clear delimitation. (C) Drusenoid lesions, where the purple arrow pointing to the pigmentary abnormalities that seem to correlate with the hyperautofluorescent lesions in images (A,B). (D) On the SD-OCT image, irregular RPE and drusenoid lesions can be seen.
Figure 11
Figure 11
Intermediate AMD in a 77-year-old male patient. (A) B-FAF multiple hyper- and hypoautofluorescent lesions that spread beyond the temporal vascular arcades, however the central macular region is obscured in shadow (blue circle). (B) G-FAF of the same eye with an enhanced central area (green circle), displaying more clearly the same foveal lesions, arranged in a “speckled pattern”. (C) Soft drusen and pigmentary abnormalities spread from the foveal area and beyond the macula in cSLO imaging. (D) Multiple drusenoid lesions in a central scan through the fovea on SD-OCT.
Figure 12
Figure 12
Late AMD, GA in an 82-year-old female patient. (A) Central hypoautofluorescent area of GA on B-FAF (between the green arrows), including the spared of atrophy area (red arrow). (B) Multiple round patches (green arrows), but with a partial foveal sparing obvious by comparison with B-FAF (red arrow). White arrow heads in (A,B) point to focal points of hyperautofluorescence. (C) Central GA, with visible choroidal vessels and hard and soft drusen areas extending beyond the macular region. (D) In the SD-OCT image, the green arrows correspond to the area of GA, with outer retinal atrophy and RPE atrophy and obvious hypertransmission. The red arrow corresponds to the spared nasal quadrant of the fovea, and the yellow arrows point toward to the soft, confluent drusen.
Figure 13
Figure 13
GA in a 67-year-old female patient. (A) “Branching” diffuse pattern of GA with a hypoautofluorescent area (green arrow) and adjacent branch-like hyperautofluorescent lesions on B-FAF. Upon initial observation, the fovea may seem affected by the GA region. (B) In the G-FAF image, the foveal sparing (green arrow) was more precise than in the first image. (C) Small area of GA, with visible choroidal vessels and multiple medium and large drusen. (D) Green arrow corresponds to the atrophic area, yellow arrow points to multiple drusenoid lesions.
Figure 14
Figure 14
Neovascular AMD in an 82-year-old female. (A) Central reduced autofluorescence area and a visible reticular pattern on B-FAF in the upper quadrant delineated by the dotted red rectangle, (B) In G-FAF, the area of hypoautofluorescence is reduced and exhibits a clearer boundary. The dotted red rectangle contains the reticular pattern (C) SDD in the upper quadrant (dotted red rectangle) and central fibrovascular PED. (D) En-face SD-OCT image of (E,F) irregular mixed type PED (white arrow) with adjacent hyperreflective foci (arrow heads) (E) Represents the horizontal section (corresponds to the horizontal red arrow in (D)), while (F) represents the vertical section (and corresponds to the vertical red arrow in (D)). (G) Choroidal neovascularization visible in en-face OCT-A image, and (H) in section of OCT-A.

Similar articles

References

    1. Mitchell P., Liew G., Gopinath B., Wong T.Y. Age-related macular degeneration. Lancet. 2018;392:1147–1159. doi: 10.1016/S0140-6736(18)31550-2. - DOI - PubMed
    1. Steinmetz J.D., Bourne R.R.A., Briant P.S., Flaxman S.R., Taylor H.R.B., Jonas J.B., Abdoli A.A., Abrha W.A., Abualhasan A., Abu-Gharbieh E.G., et al. Causes of Blindness and Vision Impairment in 2020 and Trends over 30 years, and Prevalence of Avoidable Blindness in Relation to VISION 2020: The Right to Sight: An analysis for the Global Burden of Disease Study. Lancet Glob. Health. 2021;9:e144–e160. doi: 10.1016/S2214-109X(20)30489-7. - DOI - PMC - PubMed
    1. Wong W.L., Su X., Li X., Cheung C.M.G., Klein R., Cheng C.-Y., Wong T.Y. Global prevalence of age-related macular degeneration and disease burden projection for 2020 and 2040: A systematic review and meta-analysis. Lancet Glob. Health. 2014;2:e106–e116. doi: 10.1016/S2214-109X(13)70145-1. - DOI - PubMed
    1. Vemulakonda G.A., Bailey S.T., Kim S.J., Kovach J.L., Lim J.I., Ying G., Flaxel C.J. Age-Related Macular Degeneration Preferred Practice Pattern®. Ophthalmology. 2025;132:P1–P74. doi: 10.1016/j.ophtha.2024.12.018. - DOI - PubMed
    1. Schmidt-Erfurth U., Chong V., Loewenstein A., Larsen M., Souied E., Schlingemann R., Eldem B., Monés J., Richard G., Bandello F. Guidelines for the management of neovascular age-related macular degeneration by the European Society of Retina Specialists (EURETINA) Br. J. Ophthalmol. 2014;98:1144–1167. doi: 10.1136/bjophthalmol-2014-305702. - DOI - PMC - PubMed

LinkOut - more resources