. 2025 Jun 20;14(13):1897.
doi: 10.3390/plants14131897.

The Fusion Gene BPI-LY, Encoding Human Bactericidal/Permeability-Increasing Protein Core Fragments and Lysozyme, Enhanced the Resistance of Transgenic Tomato Plants to Bacterial Wilt

Affiliations

The Fusion Gene BPI-LY, Encoding Human Bactericidal/Permeability-Increasing Protein Core Fragments and Lysozyme, Enhanced the Resistance of Transgenic Tomato Plants to Bacterial Wilt

Lei Ni et al. Plants (Basel). .

Abstract

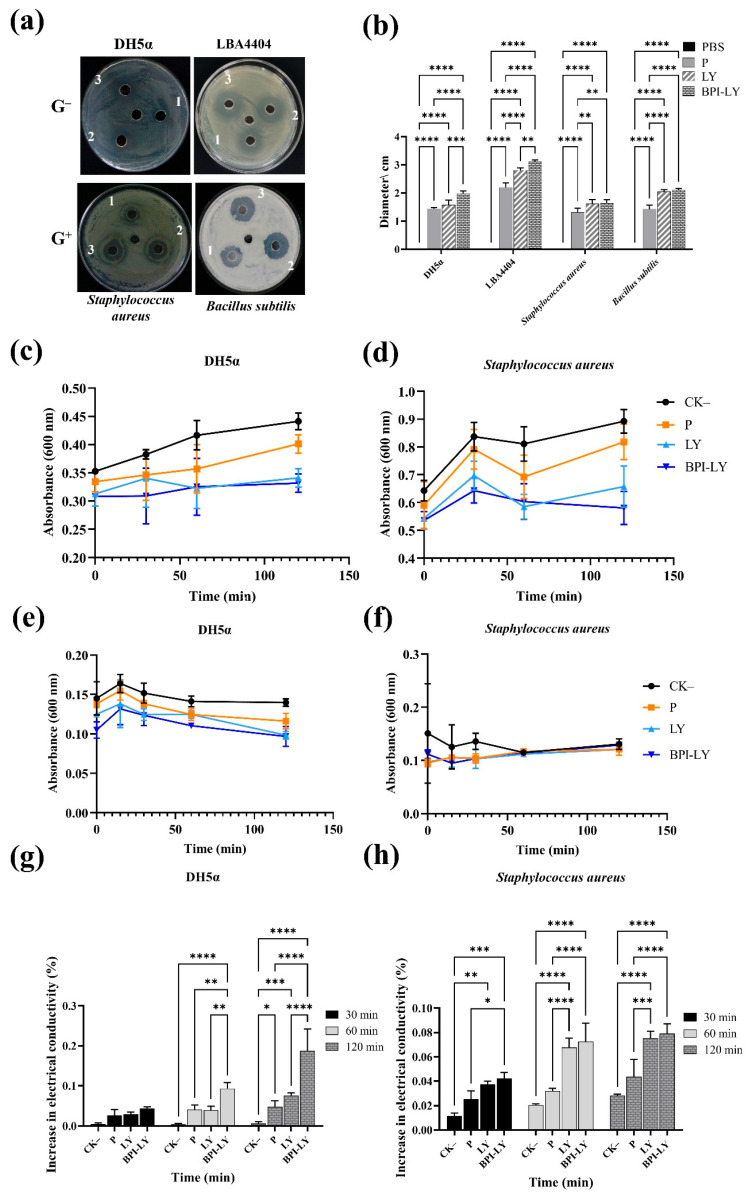
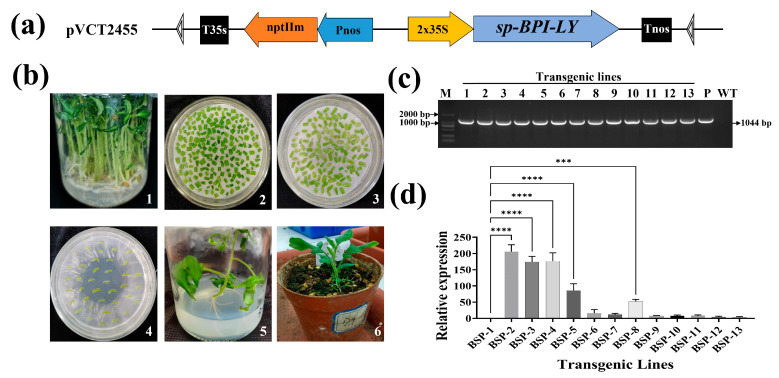
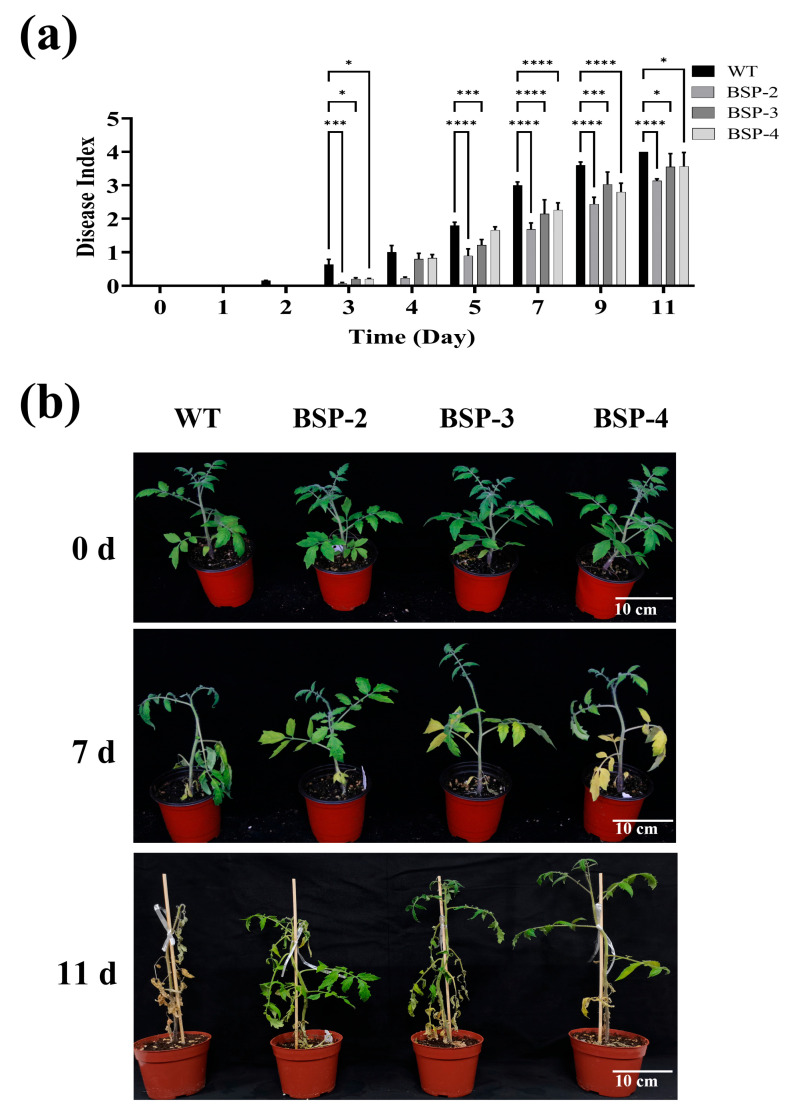
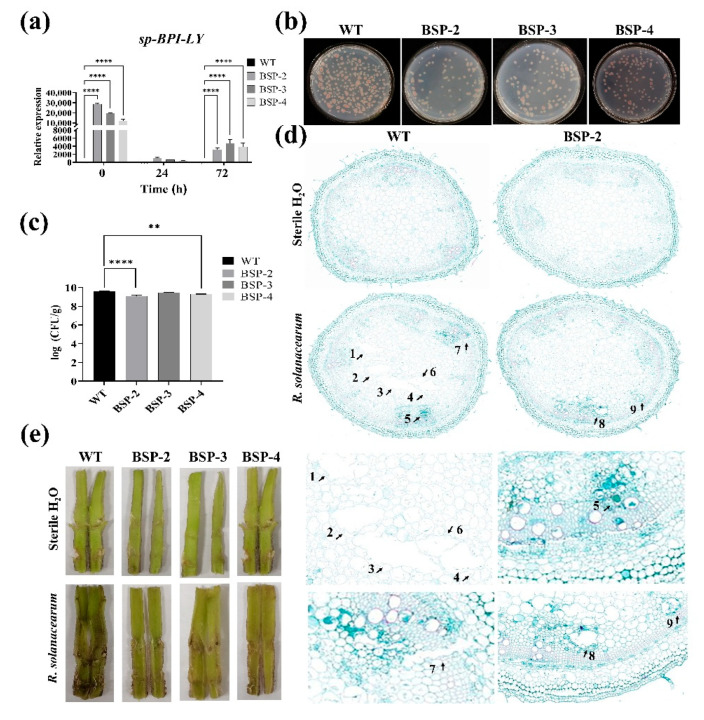
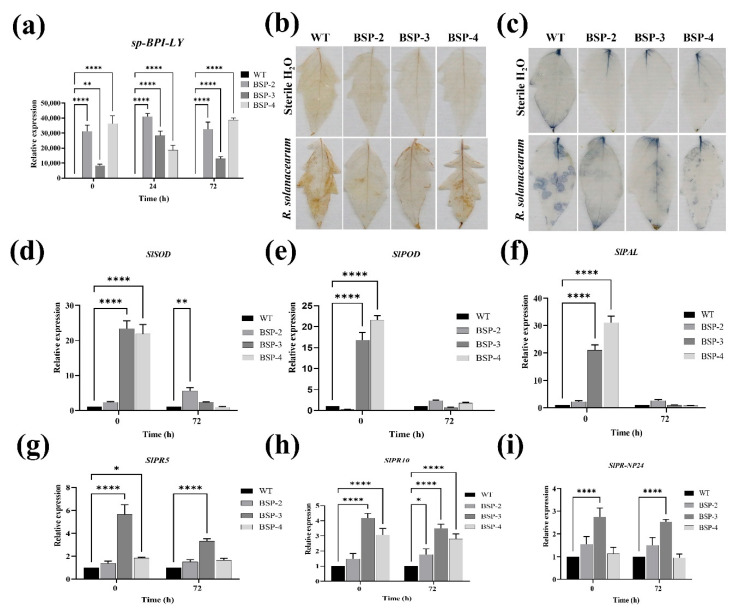
Tomato bacterial wilt, caused by Ralstonia solanacearum (G-), is one of the most devastating plant diseases. Developing effective resistance against this pathogen remains a major challenge in plant disease management. In this study, we constructed a fusion gene BPI-LY by combining the gene encoding the lipophilic functional domains of human bactericidal/permeability-increasing protein (BPI) with the gene of human lysozyme (LY). The recombinant gene BPI-LY was heterologously expressed in yeast and tomato. Preliminary in vitro assays in yeast demonstrated that BPI enhances LY's antibacterial activity against G- bacteria. Furthermore, overexpression of BPI-LY in tomato delayed onset of the disease in the transgenic lines and lowered the degree of tissue damage and the number of bacteria present in the stems relative to those in the wild-type plant. Additionally, the expression levels of the SlSOD, SlPOD, SlPAL, SlPR5, SlPR10, and SlPR-NP24 genes were indirectly upregulated in the transgenic plants following R. solanacearum inoculation. Collectively, these findings demonstrate that BPI-LY enhances the resistance of transgenic tomato against bacterial wilt caused by R. solanacearum.

Keywords: Ralstonia solanacearum; bacterial wilt; bactericidal/permeability increasing protein and lysozyme fusion gene (BPI-LY); disease resistance; tomato.


Conflict of interest statement

The authors declare no conflict of interest.

Figures

Figure 1
Figure 1
Antimicrobial activity of antimicrobial proteins in vitro. (a) Agar well diffusion test results. The middle hole represents PBS; 1: protein supernatant from empty vector P; 2: protein supernatant from LY; 3: protein supernatant from BPI-LY. The Gram-negative (G) bacteria are Escherichia coli strain DH5α and Agrobacterium tumefaciens strain LBA4404. The Gram-positive (G+) bacteria are Staphylococcus aureus and Bacillus subtilis. (b) Antibacterial statistics of the agar plate. (c) Effect on the growth curve of DH5α. (d) Effect on the growth curve of S. aureus. (e) Effect on the bactericidal curve of DH5α. (f) Effect on the bactericidal curve of S. aureus. (g) Effect on the conductivity of DH5α. (h) Effect on the conductivity of S. aureus. All experiments were set up in triplicate and repeated three times. The results are expressed as the mean ± standard deviation, and statistical analysis was conducted using two-way ANOVA; α = 0.05, * p < 0.05, ** p < 0.01, *** p < 0.001, **** p < 0.0001.
Figure 2
Figure 2
Acquisition of transgenic lines expressing the sp-BPI-LY gene. (a) T-DNA structure of the pVCT2455-sp-BPI-LY vector. T35s: Terminator of CaMV 35S gene; nptIIm: Neomycin phosphotransferase gene II; Pnos: Promoter of nopaline synthase gene; 2x35S: 2 x CaMV 35S Promoter; sp-BPI-LY: The fusion gene encoding secretion signal peptide (sp), the lipophilic functional domains of human bactericidal/permeability-increasing protein (BPI), and human lysozyme (LY); Tnos: Terminato of nopaline synthase gene. (b) Genetic transformation of tomato (1: aseptic seedlings; 2: precultured explants; 3: cocultured explants; 4: selected explants; 5: rooting cultivation; 6: transplanted seedling of transgenic plants). (c) PCR detection of the sp-BPI-LY gene in transgenic lines (M: 2000 bp DNA marker; 1–13: transgenic lines; P: plasmid positive control; WT: negative control). (d) Relative sp-BPI-LY expression levels of transgenic lines (BSP-1 to BSP-13 represent 13 transgenic lines positive for sp-BPI-LY expression). Three biological replicates were set with three technical replicates. The results are expressed as the mean ± standard deviation, and statistical analysis was conducted using one-way ANOVA; α = 0.05, *** p < 0.001, **** p < 0.0001.
Figure 3
Figure 3
Phenotype and disease index of tomato after inoculation with Ralstonia solanacearum. (a) Disease indices for different growing days. Results are expressed as the mean ± standard deviation, and statistical analysis was performed using two-way ANOVA; α = 0.05, * p < 0.05, *** p < 0.001, **** p < 0.0001. (b) Comparison of seedling growth before and 7 and 11 days after inoculation; 0 d: Before inoculation; 7 d: inoculation for 7 days; 11 d: inoculation for 11 days. Note: WT: wild type; BSP-2, BSP-3, and BSP-4: T2 homozygous line offspring corresponding to the high sp-BPI-LY expression lines in the T0 generation. Every 10 seedlings constituted a group, and the experiment was repeated three times.
Figure 4
Figure 4
The effect of overexpression of sp-BPI-LY on tomato stems infected with R. solanacearum. (a) sp-BPI-LY expression levels in tomato stems of different transgenic lines at different times. Note: WT: wild type; BSP-2, BSP-3, and BSP-4: T2 homozygous line offspring corresponding to the high sp-BPI-LY expression lines in the T0 generation. Results are expressed as the mean ± standard deviation, and statistical analysis was performed using two-way ANOVA; α = 0.05, **** p < 0.0001. (b) Bacterial growth in the stems of WT and transgenic lines after 11 days of R. solanacearum infection. (c) Bacterial content in the stems of WT and transgenic lines after 11 days of R. solanacearum infection. Results are expressed as the mean ± standard deviation, and statistical analysis was performed using one-way ANOVA; α = 0.05, ** p < 0.01, **** p < 0.0001. (d) Paraffin-embedded cross-sections of stems. The first column shows the sterile water control, and the second column shows the inoculation effects. BSP-2 is the transgenic line with the highest sp-BPI-LY expression level. The small black arrow and number indicates the damage caused by R. solanacearum. 1–7: WT inoculated with R. solanacearum; 8–9: BSP-2 inoculated with R. solanacearum; the pictures above were the whole stem cross-sections, and the bottom pictures were the same sites after magnification. (e) Anatomical diagram of longitudinal sections of stems. The first column shows the sterile water control, and the second column shows the inoculation treatment effects. The experimental parts of a, b, and c used three biological replicates and were repeated three times, and the experimental parts of d and e used three biological replicates.
Figure 5
Figure 5
Effect of sp-BPI-LY overexpression on the ROS accumulation and the expression of defense enzyme-related genes and pathogenesis-related genes in tomato. (a) sp-BPI-LY gene expression levels in leaves of different transgenic tomato lines at different times. (b) DAB staining. WT represents the wild type; BSP-2, BSP-3, and BSP-4 represent the transgenic lines positive for sp-BPI-LY expression; sterile H2O is the control; and R. solanacearum is the disease causal agent; this is the same below. (c) NBT staining. (d) SlSOD gene expression. (e) SlPOD gene expression. (f) SlPAL gene expression. (g) SlPR5 gene expression. (h) SlPR10 gene expression. (i) SlPR-NP24 gene expression. Results are expressed as the mean ± standard deviation, and the statistical analysis was performed using two-way ANOVA; α = 0.05, * p < 0.05, ** p < 0.01, **** p < 0.0001. The experimental parts of (b,c) used three biological replicates, and the experimental parts of (a,di) used three biological replicates and were repeated three times.
Figure 6
Figure 6
Transcriptome analysis results and real-time PCR verification of differentially expressed genes (DEGs). (a) Venn diagram of DEGs in the WT and transgenic lines. WT represents the wild type after pathogen inoculation, WT-CK represents the wild type before inoculation, BSP represents the sp-BPI-LY-positive transgenic strain after inoculation, and BSP-CK represents the transgenic strain before inoculation; this is the same below. The non-overlapping regions on the Venn diagram represent differential genes unique to the group, whereas the overlapping regions represent DEGs common to the several groups. (b) Number of DEGs between the WT and transgenic lines; up represents upregulated DEGs, whereas down represents downregulated DEGs. (c) GO classification map of DEGs in the sp-BPI-LY (BSP) lines after pathogen inoculation, with WT as a control. (d) Statistics of KEGG enrichment of DEGs in the sp-BPI-LY (BSP) lines after inoculation, with WT as a control. The ordinate represents the KEGG pathway, and the abscissa represents the Rich factor, which is the ratio of the number of DEGs annotated to an item to the total number of genes annotated to that item. The larger the Rich factor, the greater the degree of enrichment. The size of the dots represents the number of genes enriched in this pathway: the larger the number, the bigger the dots. The colors of the dots represent the significance of enrichment for this pathway, assessed with the corrected P. The closer the p-value is to 0, the redder the color is, which represents a more substantial enrichment. (e) Heat map of some DEGs in transcriptome data. The ordinate represents the differential gene, and the abscissa represents the different treatments. The color ranges from green to red, with a redder color representing a higher amount of expression. (f) Validation of upregulated genes in the WT and BSP transgenic lines. ns: not significant. (g) Validation of downregulated genes in the WT and BSP transgenic lines. All samples were collected from three biological replicates of each treatment at specified intervals. The results are expressed as the mean ± standard deviation, and statistical analysis was performed using t-tests; α = 0.05, ** p < 0.01, *** p < 0.001, **** p < 0.0001.

Similar articles

References

    1. Salanoubat M., Genin S., Artiguenave F., Gouzy J., Mangenot S., Arlat M., Billault A., Brottier P., Camus J.C., Cattolico L., et al. Genome sequence of the plant pathogen Ralstonia solanacearum. Nature. 2002;415:497–502. doi: 10.1038/415497a. - DOI - PubMed
    1. Xue H., Lozano-Durán R., Macho A.P. Insights into the root invasion by the plant pathogenic bacterium Ralstonia solanacearum. Plants. 2020;9:516. doi: 10.3390/plants9040516. - DOI - PMC - PubMed
    1. Wang Y., Xian L., Yu G., Macho A.P. Tomato stem injection for the precise assessment of Ralstonia solanacearum fitness in planta. Bio. Protoc. 2021;11:e4134. doi: 10.21769/BioProtoc.4134. - DOI - PMC - PubMed
    1. Peeters N., Guidot A., Vailleau F., Valls M. Ralstonia solanacearum, a widespread bacterial plant pathogen in the post-genomic era. Mol. Plant Pathol. 2013;14:651–662. doi: 10.1111/mpp.12038. - DOI - PMC - PubMed
    1. Genin S. Molecular traits controlling host range and adaptation to plants in Ralstonia solanacearum. New Phytol. 2010;187:920–928. doi: 10.1111/j.1469-8137.2010.03397.x. - DOI - PubMed

LinkOut - more resources