. 2025 Jun 29;14(13):1988.
doi: 10.3390/plants14131988.

Fine Mapping of QTLs/QTNs and Mining of Genes Associated with Race 7 of the Soybean Cercospora sojina by Combining Linkages and GWAS

Affiliations

Fine Mapping of QTLs/QTNs and Mining of Genes Associated with Race 7 of the Soybean Cercospora sojina by Combining Linkages and GWAS

Yanzuo Liu et al. Plants (Basel). .

Abstract

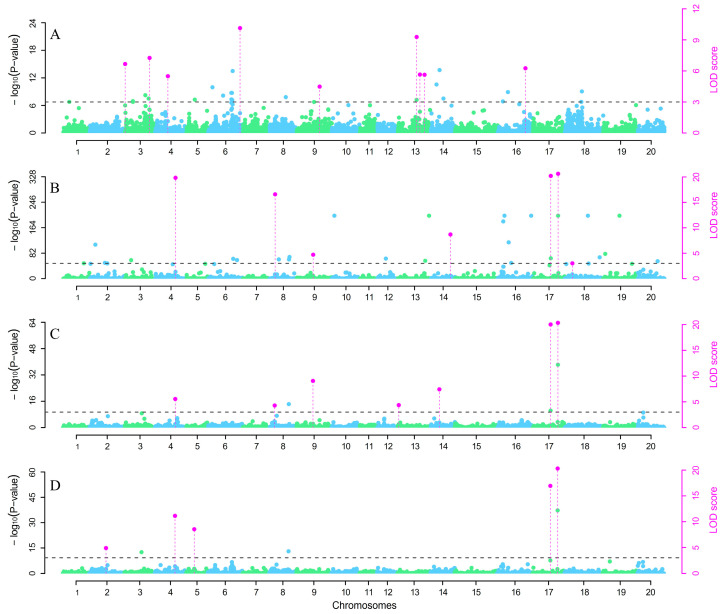
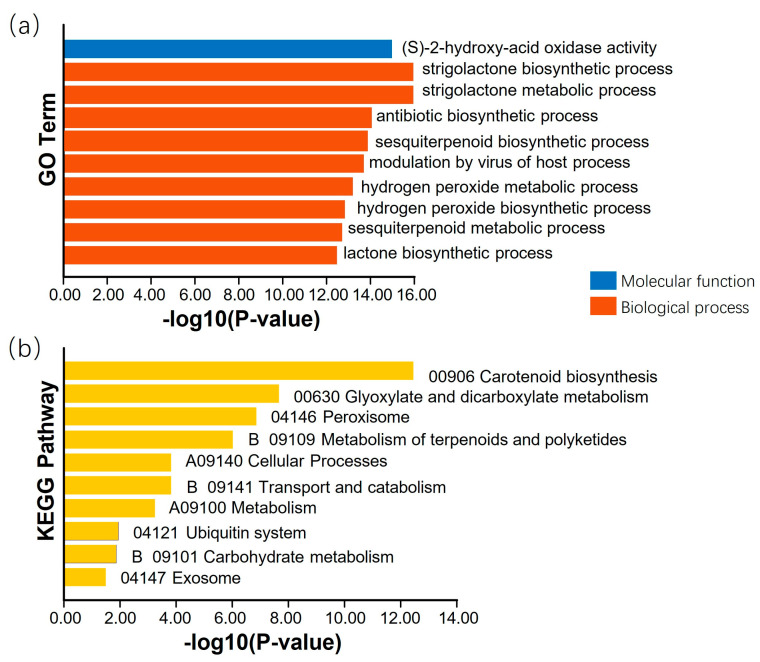
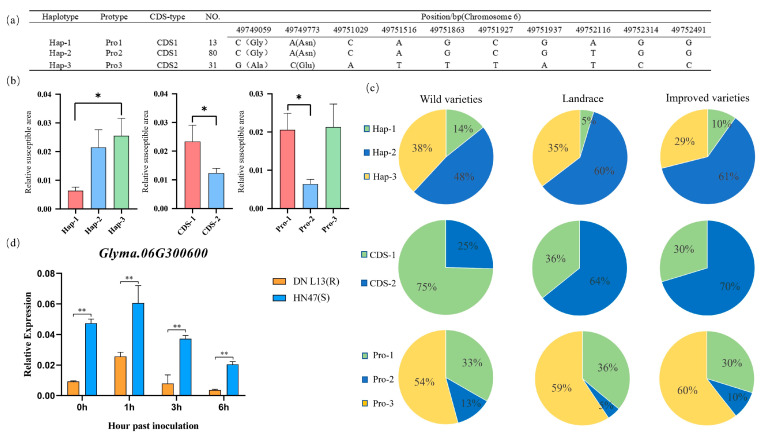
Soybean frogeye leaf spot (FLS) disease has been reported globally and is caused by the fungus Cercospora sojina, which affects the growth, seed yield, and quality of soybean. Among the 15 physiological microspecies of C. sojina soybean in China, Race 7 is one of the main pathogenic microspecies. A few genes are involved in resistance to FLS, and they cannot meet the need to design molecular breeding methods for disease resistance. In this study, a soybean recombinant inbred line (RIL3613) population and a germplasm resource (GP) population were planted at two sites, Acheng (AC) and Xiangyang (XY). Phenotypic data on the percentage of leaf area diseased (PLAD) in soybean leaves were obtained via image recognition technology after the inoculation of seven physiological species and full onset at the R3 stage. Quantitative trait loci (QTLs) and quantitative trait nucleotides (QTNs) were mapped via linkage analysis and genome-wide association studies (GWASs), respectively. The resistance genes of FLS were subsequently predicted in the linkage disequilibrium region of the collocated QTN. We identified 114 QTLs and 18 QTNs in the RIL3613 and GP populations, respectively. A total of 14 QTN loci were colocalized in the two populations, six of which presented high phenotypic contributions. Through haplotype-phenotype association analysis and expression quantification, three genes (Glyma.06G300100, Glyma.06G300600, and Glyma.13G172300) located near molecular markers AX-90524088 and AX-90437152 (QTNs) are associated with FLS Chinese Race 7, identifying them as potential candidate resistance genes. These results provide a theoretical basis for the genetic mining of soybean antigray spot No. 7 physiological species. These findings also provide a theoretical basis for understanding the genetic mechanism underlying FLS resistance in soybeans.

Keywords: QTL; QTN; cultivar leaf spot; resistance gene; soybean.


Conflict of interest statement

The authors declare no conflicts of interest.

Figures

Figure 1
Figure 1
Distribution of PLAD QTLs on 20 chromosomes during infection of the soybean FLS Race 7. Note: The innermost circular plot depicts the soybean gene density heatmap (the color gradient represents the number of genes per megabase (genes/Mb)), the middle ring illustrates the gene density frequency distribution, and the outermost ring visually maps the localization of 90 PLAD-associated QTLs across 20 chromosomes in this study. The chromosome nomenclature is exemplified by qFLS7-1–3: the prefix “qFLS7” denotes a quantitative trait locus (QTL) for resistance to FLS Chinese Race 7, the middle digit “1” indicates the chromosome number, and the suffix “3” designates the QTL identifier on that chromosome.
Figure 2
Figure 2
Venn diagram of the number of PLAD QTLs mapped among the two environments and the average number of PLAD QTLs mapped. Note: AC: quantity of QTLs mapped based on the PLAD phenotypic data in the single environment of AC; XY: The quantity of QTLs mapped based on the PLAD phenotypic data in the single environment of XY. AVE: The quantity of QTLs mapped based on the mean value of PLAD phenotypic data from the AC and XY environments. The overlapping region denotes the number of QTLs identified through repeated mapping (i.e., colocalized QTLs across different environments).
Figure 3
Figure 3
Manhattan plot of the genome-wide association study of PLAD in the GP populations. (A): QTN detected in the AC environment; (B): QTN detected in the XY environment; (C): Main QTN in the two environments; (D): QTN by environment interactions (QEIs) in the two environments. Note: Green and blue dots represent the distribution of single nucleotide polymorphisms (SNPs) across the chromosomes; Pink dots indicate SNPs with high −log10(p-value) and LOD score values at specific chromosomal positions; Pink vertical lines indicate the precise locations of significantly associated SNPs on the chromosomes.
Figure 4
Figure 4
KEGG and GO analyses. Note: The X-axis represents -log10 (p value), reflecting the enrichment significance of the GO/KEGG terms. Larger values indicate smaller p values and more significant enrichment. (a) GO enrichment. The Y-axis presents GO terms categorized into molecular functions (blue bars) and biological processes (red bars), illustrating significantly enriched biological functional categories. (b) KEGG enrichment. The Y-axis lists KEGG pathway names, sorted by categories such as metabolic pathways and signal transduction, to display significantly enriched biological pathways.
Figure 5
Figure 5
Analysis of the haplotype and expression level of the Glyma.06G300600 gene. (a) Information on the mutation of the Glyma.06G300600 gene. (b) Haplotype analysis of Glyma.06G300600. Note: The bar height denotes the relative susceptible area. Different colors distinguish sample groups: Hap-1/Hap-2/Hap-3 represent distinct gene haplotypes; CDS-1/CDS-2 are coding sequences; and Pro-1/Pro-2/Pro-3 denote promoter regions. A t-test (and non-parametric tests) was used to assess intergroup differences, with * indicating p < 0.05. (c) Proportion of different haplotypes of the Glyma.06G300600 gene in three types of varieties. (d) Analysis of the expression pattern of the Glyma.06G300600 gene. Note: Bar height denotes the mRNA level of each candidate gene in the resistant soybean variety (HN 47) and the susceptible soybean variety (DN L13). These values are the averages of three biological replicates. A t test (and non-parametric tests) was used to assess intergroup differences, with ** indicating p < 0.01.
Figure 6
Figure 6
Haplotype analysis of the Glyma.06G300100 gene. (a) Information on the mutation of the Glyma.06G300100 gene. (b) Haplotype analysis of the Glyma.06G300100 gene; * represents p < 0.05. Haplotype analysis of Glyma.06G300100. Note: The bar height denotes the relative susceptible area. Different colors distinguish sample groups, and Hap-1 and Hap-2 represent distinct haplotypes of the gene. A t test (and non-parametric tests) was used to assess intergroup differences, with * indicating p < 0.05. (c) Proportion of different haplotypes of the Glyma.06G300100 gene in three types of variety.
Figure 7
Figure 7
Analysis of the haplotype and expression level of the Glyma.13G172300 gene. (a) Information on the mutation of the Glyma.13G172300 gene; (b) haplotype analysis of the Glyma.13G172300 gene. Note: The bar height denotes the relative susceptible area. Different colors distinguish sample groups, and Hap-1, Hap-2, and Hap-3 represent distinct gene haplotypes. A t-test (and non-parametric tests) was used to assess intergroup differences, with * indicating p < 0.05. (c) The proportion of different haplotypes of the Glyma.13G172300 gene in three types of varieties. (d) Analysis of the expression pattern of the Glyma.13G172300 gene. Note: Bar height denotes the mRNA level of each candidate gene in the resistant soybean variety (HN 47) and the susceptible soybean variety (DN L13). These values are the averages of three biological replicates. A t-test (and non-parametric tests) was used to assess intergroup differences, with ** indicating p < 0.01.
Figure 8
Figure 8
Comparison of the tertiary structures of proteins with different genotypes of the Glyma.06G300600 gene. (a) Tertiary structure of the CDS-1-type protein. (b) Tertiary structure of the CDS-2-type protein. (c) Overlay diagram of the tertiary structures of the CDS-1 and CDS-2 types. (d) Binding sites affecting the tertiary structure of the protein.
Figure 9
Figure 9
Comparison of the tertiary structures of proteins with different genotypes of the Glyma.06G300100 gene. (a) Tertiary structure of the Hap-1-type protein. (b) Tertiary structure of the Hap-2-type protein. (c) Overlay diagram of the tertiary structures of the Hap-1 and Hap-2 types. (d) Binding sites affecting the tertiary structure of the protein.
Figure 10
Figure 10
Analysis of the promoter elements of the Glyma.13G172300 gene.
Figure 11
Figure 11
Analysis of the promoter elements of the Glyma.06G300600 gene.

Similar articles

References

    1. Kim H., Newell A.D., Cota-Sieckmeyer R.G., Rupe J.C., Fakhoury A.M., Bluhm B.H. Mating-type distribution and genetic diversity of Cercospora sojina populations on soybean from Arkansas: Evidence for potential sexual reproduction. Phytopathology. 2013;103:1045–1051. doi: 10.1094/PHYTO-09-12-0229-R. - DOI - PubMed
    1. Athow K., Probst A.H. The inheritance of resistance to frog-eye leaf spot of soybeans. Phytopathology. 1952;42:660–662.
    1. Yorinori J.T. Management of foliar fungal diseases in soybean in Brazil. In: Copping L.G., Green M.B., Rees R.T., editors. Pest Management in Soybean. Springer; Dordrecht, The Netherlands: 1992. pp. 185–195.
    1. Mian M.A.R., Missaoui A.M., Walker D.R., Phillips D.V., Boerma H.R. Frogeye leaf spot of soybean: A review and proposed race designations for isolates of Cercospora sojina Hara. Crop Sci. 2008;48:14–24. doi: 10.2135/cropsci2007.08.0432. - DOI
    1. Soares A.P.G., Guillin E.A., Borges L.L., Silva A.C.T.d., Almeida Á.M.R.d., Grijalba P.E., Gottlieb A.M., Bluhm B.H., Oliveira L.O.d. More Cercospora species infect soybeans across the Americas than meets the eye. PLoS ONE. 2015;10:e0133495. doi: 10.1371/journal.pone.0133495. - DOI - PMC - PubMed

LinkOut - more resources