

Innovative Aesthetic and Functional Orthodontic Planning with Hard and Soft Tissue Analyses
- PMID: 40648832
- PMCID: PMC12249615
- DOI: 10.3390/jcm14134458
Innovative Aesthetic and Functional Orthodontic Planning with Hard and Soft Tissue Analyses
Abstract
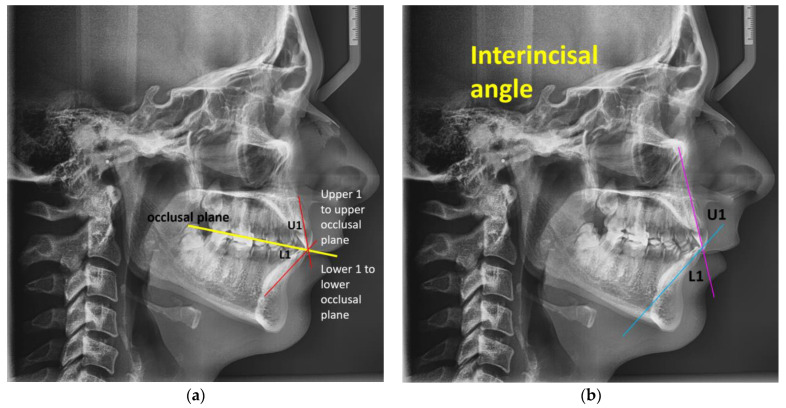
Background/Objectives: This study aims to investigate the correlation between facial soft tissues, teeth, and skeletal growth patterns in order to provide an accurate diagnosis and orthodontic treatment plan using digital examination of lateral cephalograms. Achieving the best orthodontic outcome begins with an accurate, timely, and thorough diagnosis before starting the treatment phase. Methods: This cross-sectional study investigated the correlation between facial soft tissues, dental hard tissues, and skeletal growth patterns in 100 Romanian orthodontic patients (52 females, 48 males; median age 26 years) using digital lateral cephalograms. The measurements included skeletal parameters (ANB angle, FMA, Wits appraisal), dental parameters (inclinations of upper and lower incisors, interincisal angle), and soft tissue parameters (nasolabial angle, upper and lower lip positions relative to E-plane), all assessed using the AI-powered WEBCEPH software. Statistical analysis was conducted using RStudio (version 4.3.1). Results: A total of 100 subjects (52% female; median age, 26 years [range, 19-32 years]) were evaluated. No significant gender-based differences were found across cephalometric, soft tissue, or dental parameters. When stratified by ANB classification (Class I, 41%; Class II, 48%; Class III, 11%), significant differences emerged in the interincisal angle (p = 0.047), L1-to-LOP measurement (p < 0.001), lip-to-E-plane distances (p ≤ 0.009), Wits appraisal (p < 0.001), and the ANB angle itself (p < 0.001). Furthermore, stratification by FMA classification revealed expected differences in FMA values (p < 0.001) and a significant variation in the distribution of ANB classes (p = 0.042). All other cephalometric and soft tissue parameters remained comparable across FMA categories. Conclusions: The study highlights the importance of integrating hard and soft tissue analyses in orthodontic diagnosis and treatment planning to achieve optimal aesthetic and functional outcomes.
Keywords: AI; ANB; FMA; L1 to LOP; U1 to UOP; WEBCEPH; Wits; digital analysis; interincisal angle; lower lip to E-plane; nasolabial angle; orthodontics; upper lip to E-plane.
Conflict of interest statement
The authors declare no conflicts of interest.
Figures


References
-
- Tucci I., Sferra S., Giuliante L., Scribante A., Mannocci A., Grippaudo C. Relationship Between Vertical Facial Patterns and Palatal Morphology in Class I and Class II Malocclusion. Appl. Sci. 2025;15:604. doi: 10.3390/app15020604. - DOI
LinkOut - more resources
Full Text Sources
