Review
. 2025 Jul 7;14(13):4789.
doi: 10.3390/jcm14134789.

Pregestational Diabetes Mellitus and Adverse Perinatal Outcomes: A Systematic Review and Meta-Analysis

Affiliations
Review

Pregestational Diabetes Mellitus and Adverse Perinatal Outcomes: A Systematic Review and Meta-Analysis

Dionysios Gazis et al. J Clin Med. .

Abstract

Background/Objectives: As the incidence of diabetes mellitus (DM) is increasing rapidly worldwide, it is anticipated that an increasing number of women will enter pregnancy with pregestational diabetes mellitus (PGDM) in the future. Compelling evidence suggests that hyperglycemia in pregnancy is related to multiple adverse perinatal outcomes. This systematic review and meta-analysis aims to assess and quantify the association of PGDM with a range of adverse perinatal outcomes, providing a comprehensive understanding of its impact on pregnancy. Methods: The data sources of this systematic review and meta-analysis were Medline/PubMed, Scopus and Cochrane Library (January 1999 to August 2023), complemented by hand-searching for additional references. Observational studies reporting perinatal outcomes of pregnancies with PGDM diagnosed before pregnancy versus control pregnancies were eligible for inclusion. A systematic review and meta-analysis were conducted as per the PRISMA guidelines. Pooled estimate odds ratios (ORs) with 95% confidence intervals (CIs) were calculated to determine the risk of adverse pregnancy outcomes between PGDM and control pregnancies. Results: The systematic search of the literature yielded 81 observational studies meeting inclusion criteria and in total, 137,237,640 pregnancies were included in the analysis. A total of 19 adverse perinatal outcomes were assessed, revealing a significant association with PGDM. In pregnancies with PGDM there was an increased risk of adverse perinatal outcomes, including gestational hypertension (OR 3.16, 95% CI 2.65-3.77), preeclampsia (OR 4.46, 95% CI 3.94-5.05), preterm delivery (OR 3.46, 95% CI 3.06-3.91), cesarean delivery (OR 3.12, 95% CI 2.81-3.47), induction of labor (OR 2.92, 95% CI 2.35-3.63), macrosomia (OR 2.23, 95% CI 1.76-2.83), LGA neonates (OR 3.95, 95% CI 3.47-4.49), low 5-min Apgar score (OR 2.49, 95% CI 2.07-2.99), shoulder dystocia (OR 3.05, 95% CI 2.07-4.50), birth trauma (OR 1.40, 95% CI 1.22-1.62), polyhydramnios (OR 5.06, 95% CI 4.33-5.91), oligohydramnios (OR 1.61, 95% CI 1.19-2.17), neonatal hyperbilirubinemia (OR 3.45, 95% CI 2.51-4.74), neonatal hypoglycemia (OR 19.19, 95% CI 2.78-132.61), neonatal intensive care unit (NICU) admission (OR 4.54, 95% CI 3.87-5.34), congenital malformations (OR 2.44, 95% CI 1.96-3.04), stillbirth (OR 2.87, 95% CI 2.27-3.63) and perinatal mortality (OR 2.94, 95% CI 2.18-3.98). Subgroup analyses indicated a higher risk of neonatal hypoglycemia, stillbirth and perinatal mortality in T1DM pregnancies compared with T2DM pregnancies. Conclusions: This study provides a robust synthesis of evidence underlying the strong association between PGDM and several adverse perinatal outcomes. Early detection, optimal glycemic control during the periconceptional and pregnancy periods, and proper antenatal care are critical to mitigate these risks.

Keywords: adverse outcomes; complications; maternal; neonatal; preexisting diabetes; pregnancy; type 1 diabetes; type 2 diabetes.


Conflict of interest statement

The authors declare no conflicts of interest.

Figures

Figure 1
Figure 1
Study selection flowchart.
Figure 2
Figure 2
Risk of bias graph.
Figure 3
Figure 3
Forest plot comparing the incidence of gestational hypertension between PGDM and control groups [25,26,30,31,40,60,61,67,70,73,76,77,88,92,102].
Figure 4
Figure 4
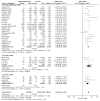
Forest plot comparing the incidence of preeclampsia between PGDM and control groups [25,26,27,28,30,31,35,47,50,51,55,57,60,61,62,64,66,67,70,72,73,76,77,78,79,86,88,92,94,99,101,103].
Figure 5
Figure 5
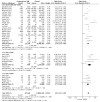
Forest plot comparing the incidence of preterm delivery between PGDM and control groups [25,26,29,30,31,33,35,49,50,51,52,55,57,60,61,62,64,66,67,70,72,73,74,75,76,77,82,85,86,88,89,90,92,93,94,95,96,97,98,100,101,103,104].
Figure 6
Figure 6
Forest plot comparing the incidence of cesarean delivery between PGDM and control groups [25,26,29,30,31,32,35,36,38,39,44,49,50,51,52,55,56,57,58,60,61,62,64,66,67,68,70,71,72,73,74,76,77,82,85,86,89,91,92,94,95,96,101,104,105].
Figure 7
Figure 7
Forest plot comparing the incidence of induction of labor between PGDM and control groups [25,26,30,31,55,58,59,60,61,70,73,76,82,89].
Figure 8
Figure 8
Forest plot comparing the incidence of macrosomia between PGDM and control groups [29,30,31,38,50,52,55,56,58,62,64,72,76,81,82,83,92,93,94,96,97,101,102].
Figure 9
Figure 9
Forest plot comparing the incidence of LGA neonates between PGDM and control groups [25,26,30,31,32,33,35,50,51,52,54,55,57,59,60,61,63,64,66,67,71,75,76,77,83,85,86,88,94,98,101,103].
Figure 10
Figure 10
Forest plot comparing the incidence of SGA neonates between PGDM and control groups [25,26,30,31,50,51,54,55,57,61,64,66,67,72,75,76,77,83,86,88,98,101,103].
Figure 11
Figure 11
Forest plot comparing the incidence of low 5-min Apgar score between PGDM and control groups [25,26,33,58,64,67,88,91,94,96].
Figure 12
Figure 12
Forest plot comparing the incidence of shoulder dystocia between PGDM and control groups [25,26,30,31,49,59,60,61,64,77,82,94,103].
Figure 13
Figure 13
Forest plot comparing the incidence of birth trauma between PGDM and control groups [55,65,76,86].
Figure 14
Figure 14
Forest plot comparing the incidence of polyhydramnios between PGDM and control groups [30,31,34,61,77,89,101].
Figure 15
Figure 15
Forest plot comparing the incidence of oligohydramnios between PGDM and control groups [34,61].
Figure 16
Figure 16
Forest plot comparing the incidence of neonatal hyperbilirubinemia between PGDM and control groups [25,26,30,31,36,55,58,61,65,76,77,86,88,101].
Figure 17
Figure 17
Forest plot comparing the incidence of neonatal hypoglycemia between PGDM and control groups [25,26,30,31,36,58,61,65,76,77,86,88].
Figure 18
Figure 18
Forest plot comparing the incidence of NICU admission between PGDM and control groups [25,26,30,31,32,55,60,61,64,66,72,74,76,77,88,89,101,104].
Figure 19
Figure 19
Forest plot comparing the incidence of congenital malformations between PGDM and control groups [25,26,29,33,35,36,37,41,42,43,46,52,53,57,61,64,65,66,69,72,74,77,82,86,87,88,94,97,102,104].
Figure 20
Figure 20
Forest plot comparing the incidence of stillbirth between PGDM and control groups [29,30,31,33,38,45,48,51,56,64,67,74,77,80,82,84,85].
Figure 21
Figure 21
Forest plot comparing the incidence of perinatal mortality between PGDM and control groups [25,26,32,33,61,64,66,72,73,76,91,97,104].

References

    1. World Health Organisation . Global Report on Diabetes. World Health Organisation; Lyon, France: 2016.
    1. Sun H., Saeedi P., Karuranga S., Pinkepank M., Ogurtsova K., Duncan B.B., Stein C., Basit A., Chan J.C., Mbanya J.C., et al. IDF Diabetes Atlas: Global, regional and country-level diabetes prevalence estimates for 2021 and projections for 2045. Diabetes Res. Clin. Pract. 2022;183:109119. doi: 10.1016/j.diabres.2021.109119. - DOI - PMC - PubMed
    1. Ogrotis I., Koufakis T., Kotsa K. Changes in the Global Epidemiology of Type 1 Diabetes in an Evolving Landscape of Environmental Factors: Causes, Challenges, and Opportunities. Medicina. 2023;59:668. doi: 10.3390/medicina59040668. - DOI - PMC - PubMed
    1. Basu S., Yoffe P., Hills N., Lustig R.H., Wagner B. The Relationship of Sugar to Population-Level Diabetes Prevalence: An Econometric Analysis of Repeated Cross-Sectional Data. PLoS ONE. 2013;8:e57873. doi: 10.1371/journal.pone.0057873. - DOI - PMC - PubMed
    1. HAPO Study Cooperative Research Group. Metzger B.E., Lowe L.P., Dyer A.R., Trimble E.R., Chaovarindr U., Coustan D.R., Hadden D.R., McCance D.R., Hod M., et al. Hyperglycemia and Adverse Pregnancy Outcomes. N. Engl. J. Med. 2008;358:1991–2002. doi: 10.1056/nejmoa0707943. - DOI - PubMed

LinkOut - more resources