. 2025 Jul 3;18(13):3163.
doi: 10.3390/ma18133163.

Effect of 3 wt% Cu on the Microstructure and Hardness of a Ti-10Ta-1.6Zr Alloy

Affiliations

Effect of 3 wt% Cu on the Microstructure and Hardness of a Ti-10Ta-1.6Zr Alloy

Nobom G Hashe et al. Materials (Basel). .

Abstract

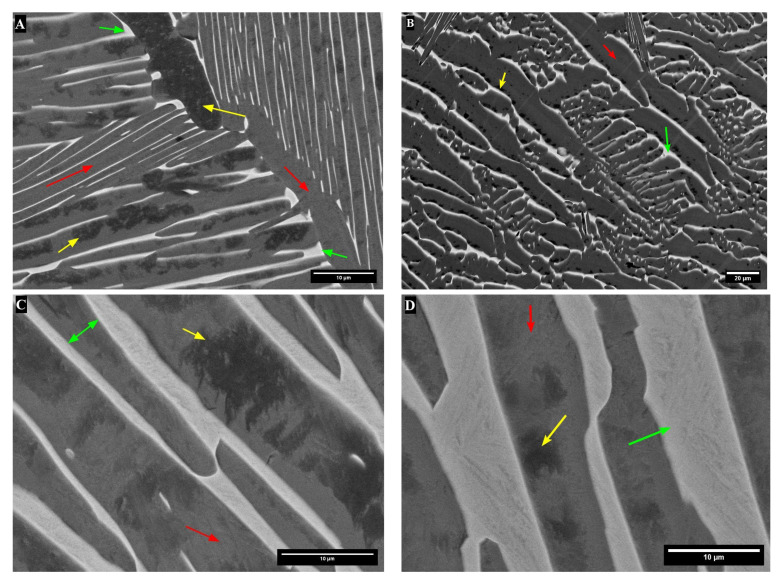
Alloys of Ti-10Ta-1.6Zr (wt%) with and without 3 wt% Cu made by arc-melting, heat-treated in two stages and quenched to have α + β microstructures were studied. These alloys were studied for potential replacement of Ti-6Al-4V alloys because Ta and Zr are more biocompatible than Al and V, and copper was added for potential antimicrobial properties. The heat-treated samples were investigated by SEM-EDX, transmission Kikuchi diffraction (TKD) and XRD. When studied at a higher magnification, the heat-treated alloys revealed a bi-lamellar microstructure, consisting of broad α lamellae and β transformed to fine α' lamellae with various orientations. The fraction β transformed to fine α' lamellae was higher in the alloy with Cu than that without Cu. Furthermore, copper was found to lower the solubility of tantalum in the β. The hardest alloy was the heat-treated alloy containing Cu, albeit with a wide standard deviation, probably due to the high fraction of martensitically transformed β.

Keywords: copper; hardness; microstructure; tantalum; titanium.


Conflict of interest statement

The authors declare no conflicts of interest.

Figures

Figure 1
Figure 1
Mole fractions of phases as a function of temperature, α = HCP_A3 in red, β = BCC_ B2 in blue and Ti2Cu = CUTI2 in green for (A) TTZ alloy and (B) TTZ-Cu alloy. The dashed line indicates the heat treatment temperature of 798 °C.
Figure 2
Figure 2
SEM-BSE images of as-cast alloys: (A,B) TTZ, and (C,D) TTZ-Cu.
Figure 3
Figure 3
Representative SEM-BSE images of (A) TTZ-HT that had overall dark-contrast areas only, (B) TTZ-Cu-HT showing overall dark-contrast areas and (C) overall bright-contrast areas of the TTZ-Cu-HT.
Figure 4
Figure 4
SEM-BSE images of (A,B), TTZ-HT showing only dark-contrast areas, and (C), TTZ-Cu-HT showing dark- and bright-contrast (D) areas compared to TTZ-HT. Arrows indicate prior β grain boundaries.
Figure 5
Figure 5
SEM-BSE images at higher magnification showing (A,B) TTZ-HT, and (C,D), TTZ-Cu-HT.
Figure 5
Figure 5
SEM-BSE images at higher magnification showing (A,B) TTZ-HT, and (C,D), TTZ-Cu-HT.
Figure 6
Figure 6
SEM-EDX micrographs showing where measurements were taken: (A,B) TTZ-HT and (C,D) TTZ-Cu-HT alloys, where yellow arrows show of the dark-contrast phase, red arrows show the medium-contrast phase and green arrows show the bright-contrast phase.
Figure 7
Figure 7
TTZ-HT alloy: (A) SEM-BSE image and (B) SEM-EDX mapping of Ta showing that the bright-contrast phase was rich in Ta.
Figure 8
Figure 8
(A) SEM image of the TTZ-Cu-HT alloy and SEM-EDX mapping of (B) Cu and (C) Ta showing that the bright-contrast phase is rich in Ta and Cu.
Figure 9
Figure 9
TKD and EDX results of TTZ-HT: (A) overview image of the area investigated with both techniques, (BD) SEM-EDX maps of (B) Ti, (C) Ta and (D) Zr, (E) band contrast, (F) phase map, (G) IPF Z map of the same area and (H) its associated IPF Z colour key.
Figure 9
Figure 9
TKD and EDX results of TTZ-HT: (A) overview image of the area investigated with both techniques, (BD) SEM-EDX maps of (B) Ti, (C) Ta and (D) Zr, (E) band contrast, (F) phase map, (G) IPF Z map of the same area and (H) its associated IPF Z colour key.
Figure 10
Figure 10
TKD and EDX results of TTZ-Cu-HT: (A) an overview image of the area investigated with both techniques, (BD) SEM-EDX maps of (B) Ti, (C) Ta, (D) Zr and (E) Cu, (F) band contrast, (G) phase map, (H) IPF Z map of the same area and (I) its associated IPF Z colour key.
Figure 11
Figure 11
XRD diffractograms of (A) TTZ and (B) TTZ-Cu alloys indexed for α phase.
Figure 12
Figure 12
Hardness results of as-cast (AC) and heat-treated (HT) TTZ and TTZ-Cu alloys.

References

    1. Ramakrishna S., Mayer J., Wintermantel E., Leong K.W. Biomedical applications of polymer-composite materials: A review. Compos. Sci. Technol. 2001;61:1189–1224. doi: 10.1016/S0266-3538(00)00241-4. - DOI
    1. Prasad K., Bazaka O., Chua M., Rochford M., Fedrick L., Spoor J., Symes R., Tieppo M., Collins C., Cao A., et al. Metallic biomaterials: Current challenges and opportunities. Materials. 2017;10:884. doi: 10.3390/ma10080884. - DOI - PMC - PubMed
    1. Patel N.R., Gohil P.P. A Review on Biomaterials: Scope, Applications and Human Anatomy Significance. Int. J. Emerg. Technol. Adv. Eng. 2012;2:99–101.
    1. Geetha M., Singh A.K., Asokamani R., Gogia A.K. Ti based biomaterials, the ultimate choice for orthopaedic implants—A review. Prog. Mater. Sci. 2009;54:397–425. doi: 10.1016/j.pmatsci.2008.06.004. - DOI
    1. Ogawa A., Akatsuka R., Tamauchi H., Hio K., Kanematsu H. Influence of the nickel-titanium alloy components on biological functions. BMC Proc. 2011;5((Suppl. S8)):79. doi: 10.1186/1753-6561-5-S8-P79. - DOI - PMC - PubMed

LinkOut - more resources