. 2025 Jun 20;26(13):5939.
doi: 10.3390/ijms26135939.

Phenotypic Plasticity and Androgen Receptor Bypass Drive Cross-Resistance to Apalutamide in Castration-Resistant Prostate Cancer Cell Models

Affiliations

Phenotypic Plasticity and Androgen Receptor Bypass Drive Cross-Resistance to Apalutamide in Castration-Resistant Prostate Cancer Cell Models

Iris Simon et al. Int J Mol Sci. .

Abstract

The treatment of choice for prostate cancer is androgen deprivation (ADT) and novel hormonal agents such as Abiraterone, Enzalutamide, or Apalutamide. Initially, this therapy is highly effective, but a significant challenge arises as most patients eventually develop resistance, resulting in castration-resistant prostate cancer (CRPC). Furthermore, the sequential use of these drugs can lead to cross-resistance, diminishing their efficacy. Tumor heterogeneity plays a pivotal role in the development of resistance to different treatments. This study utilized cellular models of CRPC to assess the response to Apalutamide when it was administered as a second- or third-line treatment. Functional and genetic analyses were conducted in various CRPC cell models exposed to Apalutamide. These analyses included real-time cell monitoring assays, flow cytometry, clonogenicity assays, and RT-qPCR. CRPC cell models were capable of continued proliferation, maintained cell cycle profiles similar to those of untreated cells, and retained their clonogenic potential. Cross-resistance to Apalutamide in models of ADT, ADT plus Enzalutamide, or Abiraterone resistance did not correlate with the expression levels of AR-V7 and AR-V9 variants. Gene expression analysis of resistant prostate cancer cell lines revealed that treatment with Apalutamide induced the emergence of more aggressive phenotypes, including cancer stem cells or neuroendocrine differentiation profiles. Most CRPC cell models developed cross-resistance to Apalutamide and were able to proliferate and retain their clonogenic capability. Apalutamide resistance was not linked to the expression of AR-V7 or AR-V9 variants but was instead associated to bypass of AR signaling pathway and the emergence of more aggressive expression profiles.

Keywords: Abiraterone; Apalutamide; Enzalutamide; androgen deprivation therapy (ADT); castration-resistant prostate cancer (CRPC); prostate cancer.


Conflict of interest statement

The authors declare no conflicts of interest.

Figures

Figure 1
Figure 1
MTT assay for IC50 calculation. Determination of IC50 for between 4 and 5 days for Apa in the LNCaP WT cell line. The graph illustrates the percentage of viable cells across the range of drug concentrations tested. Data represent the mean ± SD calculated from quadruplicate samples for each drug concentration (n = 4; mean ± SD).
Figure 2
Figure 2
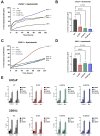
Analysis of the response of WT and CRPC cellular models to Apalutamide treatment. (A) Real-time cell proliferation analysis for LNCaP cell lines using the xCelligence system. The results have been standardized, with untreated control cell lines set as 100% (n = 4; mean ± SD). Statistics were assessed via Student’s t test (statistically significant differences: ns = non-significant, *** p < 0.001). (B) Cell doubling time. Data were normalized relative to untreated cell lines (n = 4; mean ± SD). Statistics were assessed via one-way ANOVA plus Dunnett’s multiple comparison test (statistically significant differences: **** p < 0.0001). (C) Real-time analysis of cell proliferation in 22RV1 cell lines using the xCelligence system. Data have been normalized, with untreated control cell lines designated as 100% (n = 4; mean ± SD). Statistics were assessed via Student’s t test (statistically significant differences: ns = non-significant, *** p < 0.001). (D) Cell doubling time. Data were normalized relative to untreated cell lines (n = 4; mean ± SD). Statistics were assessed via one-way ANOVA plus Dunnett’s multiple comparison test (statistically significant differences: **** p < 0.0001). (E) Cell cycle analysis with propidium iodide for WT and CRPC cellular models untreated or treated with 0.130 μM Apa. Bar charts represent the percentage of cells in different phases of the cell cycle (n = 6; mean ± SD). Statistics were assessed via two-way ANOVA plus Bonferroni’s multiple comparisons test (statistically significant differences: * p < 0.05, ** p < 0.01).
Figure 3
Figure 3
Sequential passage cell proliferation monitoring assay of WT and CRPC cellular models under apalutamide treatment. (A) Relative cell numbers after three consecutive passages in LNCaP WT and CRPC-resistant models treated with 0.130 µM Apa (n = 3; mean ± SD). (B) Corresponding analysis for 22RV1 WT and CRPC-resistant cell lines. Data were normalized to untreated control cell lines, which were set as 1 (n = 3; mean ± SD).
Figure 4
Figure 4
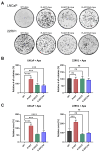
Clonogenic assays in PCa WT and CRPC cellular models treated with Apalutamide. (A) Representative images of colonies formed by the different cell lines under the specified conditions. (B) Colony count per well. Histogram data are normalized to untreated control cell lines (n = 3; mean ± SD). Statistics were assessed via one-way ANOVA plus Dunnett’s multiple comparison test (statistically significant differences: ns = non-significant, *** p < 0.001, **** p < 0.0001). (C) Colony area coverage in LNCaP and 22RV1 cellular models treated with 0.130 μM Apa. Histograms show the percentage of area occupied, normalized to the corresponding untreated control line (n = 3; mean ± SD). Statistics were assessed via one-way ANOVA plus Dunnett’s multiple comparison test (statistically significant differences: ns = non-significant, *** p < 0.001, **** p < 0.0001).
Figure 5
Figure 5
Quantification of AR total, AR full length, AR-V7, and AR-V9 and AR coactivators and target genes in response to Apalutamide in CRPC cellular models. qPCR expression analysis for AR variants in LNCaP (A) and 22RV1 (B). Data were normalized to the endogenous control (GAPDH) and expressed relative to untreated cells (n = 3; mean ± SEM). Statistics were assessed via one-way ANOVA plus Dunnett’s multiple comparison test (statistically significant differences: * p < 0.05. Similarly, heatmap representation of qPCR expression analysis for AR Coactivators in LNCaP (C) and 22RV1 (D) or AR target genes in LNCaP (E) and 22RV1 (F). Data were normalized to the endogenous control (GAPDH) and expressed relative to untreated cells (n = 3), and the relative expression scales have been created for every PCa cell line.
Figure 6
Figure 6
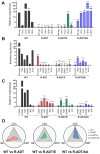
Quantification of differentiation markers associated with cancer stem cells (CSC), epithelial-to-mesenchymal transition (EMT), and neuroendocrine (NE) traits in LNCaP WT and CRPC cell lines treated with Apalutamide. qPCR expression analysis of CSC markers (A), EMT markers (B), and NE markers (C) in LNCaP WT, LNCaP R-ADT, LNCaP R-ADT/E, and LNCaP R-ADT/AA after 5 days of exposure to 0.130 μM Apa. Data were normalized to the endogenous control (GAPDH) and presented relative to untreated cells (n = 3; mean ± SEM). Statistics were assessed via two-way ANOVA plus Bonferroni’s multiple comparisons test (statistically significant differences; * p < 0.05, ** p < 0.01, *** p < 0.001). (D) Radial distribution plot illustrating the number of genes trending towards differentiation-specific profiles across LNCaP R-ADT, LNCaP R-ADT/E, and LNCaP R-ADT/AA cell lines compared to LNCaP WT cell line.
Figure 7
Figure 7
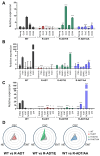
Expression analysis of differentiation markers for cancer stem cells (CSC), epithelial-to-mesenchymal transition (EMT), and neuroendocrine (NE) traits in 22RV1 WT and CRPC cell lines treated with Apalutamide. qPCR analysis of CSC markers (A), EMT markers (B), and NE markers (C) in 22RV1 WT, 22RV1 R-ADT, 22RV1 R-ADT/E, and 22RV1 R-ADT/AA cell lines after 5 days of treatment with 0.130 µM Apa. Data were normalized to the endogenous control (GAPDH) and expressed relative to untreated cells (n = 3; mean ± SEM). Statistics were assessed via two-way ANOVA plus Bonferroni’s multiple comparisons test (statistically significant differences: * p < 0.05, ** p < 0.01, *** p < 0.001). (D) Radial distribution plot showing the number of genes aligning with differentiation-specific trends in 22RV1 R-ADT, 22RV1 R-ADT/E, and 22RV1 R-ADT/AA cell lines compared to the 22RV1 WT line.

Similar articles

References

    1. Bray F., Laversanne M., Sung H., Ferlay J., Siegel R.L., Soerjomataram I., Jemal A. Global cancer statistics 2022: GLOBOCAN estimates of incidence and mortality worldwide for 36 cancers in 185 countries. CA. Cancer J. Clin. 2024;74:229–263. doi: 10.3322/caac.21834. - DOI - PubMed
    1. Huggins C., Hodges C.V. Studies on prostatic cancer: I. The effect of castration, of estrogen and androgen injection on serum phosphatases in metastatic carcinoma of the prostate. CA. Cancer J. Clin. 1972;22:232–240. doi: 10.3322/canjclin.22.4.232. - DOI - PubMed
    1. Schaeffer E.M., Srinivas S., Adra N., An Y., Bitting R., Chapin B., Cheng H.H., D’Amico A.V., Desai N., Dorff T., et al. NCCN Guidelines® Insights: Prostate Cancer, Version 3.2024. J. Natl. Compr. Cancer Netw. JNCCN. 2024;22:140–150. doi: 10.6004/jnccn.2024.0019. - DOI - PubMed
    1. Banerjee P.P., Banerjee S., Brown T.R., Zirkin B.R. Androgen action in prostate function and disease. Am. J. Clin. Exp. Urol. 2018;6:62–77. - PMC - PubMed
    1. Xu J., Qiu Y. Role of androgen receptor splice variants in prostate cancer metastasis. Asian J. Urol. 2016;3:177–184. doi: 10.1016/j.ajur.2016.08.003. - DOI - PMC - PubMed

MeSH terms

LinkOut - more resources