. 2025 Jun 24;26(13):6069.
doi: 10.3390/ijms26136069.

Transcriptomic Profiling of Zebrafish Mutant for cdkl5 Reveals Dysregulated Gene Expression Associated with Neuronal, Muscle, Visual and Skeletal Development

Affiliations

Transcriptomic Profiling of Zebrafish Mutant for cdkl5 Reveals Dysregulated Gene Expression Associated with Neuronal, Muscle, Visual and Skeletal Development

Tatiana Varela et al. Int J Mol Sci. .

Abstract

Zebrafish is a well-recognized model for studying human genetic disorders. Recently, we proposed the homozygous cdkl5sa21938 mutant zebrafish as a model of CDKL5 deficiency disorder (CDD), a developmental epileptic encephalopathy with diverse symptoms. This study aimed to explore Cdkl5-associated molecular mechanisms in zebrafish and assess their similarity to those in mammals. We conducted RNA sequencing on whole cdkl5-/- zebrafish and wild-type siblings at 5 and 35 days post-fertilization (dpf) to compare their gene expression profiles. Most significant differentially expressed genes (DEGs) were related to muscle, neuronal, and visual systems which are affected in CDD. Gene Ontology analysis revealed downregulated DEGs enriched in muscle development, extracellular matrix, and actin cytoskeleton functions at both stages, while upregulated DEGs were enriched in eye development functions at 35 dpf. The Kyoto Encyclopedia of Genes and Genomes (KEGG) analysis revealed enrichment of downregulated DEGs in focal adhesion and extracellular matrix (ECM)-receptor interaction pathways at both stages. Neuronal development DEGs were mainly downregulated at both stages, while synaptic signaling DEGs were upregulated at 35 dpf. Crossing cdkl5-/- mutants with the Hb9:GFP transgenic line showed fewer motor neuron cells with shorter axons compared to the wild type, which may explain the impaired motor phenotype observed in zebrafish and CDD patients. Moreover, we identified key downregulated DEGs related to cartilage development at both stages and bone development at 35 dpf, potentially explaining the skeletal defects seen in zebrafish and CDD individuals. In conclusion, Cdkl5 loss in zebrafish leads to dysregulation of genes involved in CDKL5-associated functions in mammals, providing new insights into its less studied functions and phenotypes.

Keywords: CDKL5 deficiency disorder; Cdkl5; RNA-seq; transcriptomic; zebrafish model.


Conflict of interest statement

The authors declare no competing interests.

Figures
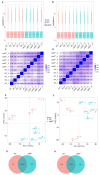
Figure 1
Figure 1
Comparison of gene expression levels between cdkl5−/− mutant zebrafish and WT siblings at 5 dpf (A,C,E,G) and 35 dpf (B,D,F,H). (A,B) Box plots of the distribution of gene expression levels based on log2 transformed FPKM (Fragments Per Kilobase of transcript per Million mapped reads) values for each sample. The abscissa axis is the sample name, and the ordinate axis represents the log2 (FPKM + 1) values. (C,D) Heatmap of the square of Pearson correlation coefficients (R2) among the ten sequenced samples. (E,F) Principal Component Analysis (PCA) maps based on the gene expression value (FPKM) of samples. The abscissa axis is the first principal component (PC1) representing the most variation in the data, and the ordinate axis is the second principal component (PC2), representing the second most variation in the data. (G,H) Venn diagram of gene expression indicating the number of common and uniquely expressed genes in the WT siblings and cdkl5−/− groups.
Figure 2
Figure 2
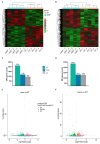
Differential gene expression analysis between cdkl5−/− mutant zebrafish and WT siblings at 5 dpf (A,C,E) and 35 dpf (B,D,F). (A,B) Heatmap of hierarchical clustering analysis of differentially expressed genes (DEGs), based on log2(FPKM+1) values. Each column corresponds to a different sample, while each row represents a distinct gene. Red and green colors indicate genes with higher and lower expression levels, respectively. (C,D) The number of differentially expressed genes in cdkl5−/− vs. WT groups. (E,F) Volcano plots show the distribution of the differentially expressed genes. The abscissa axis represents the value of log2FoldChange, and the ordinate axis represents the statistical significance value (−log10 (p value)) of gene expression between the groups. Red and green dots indicate significantly upregulated (up) and downregulated (down) genes, respectively. Blue dots represent genes with no statistically significant differences in expression (no) between the two groups.
Figure 3
Figure 3
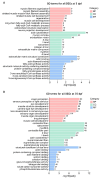
Enriched gene ontology (GO) terms for all differentially expressed genes between cdkl5−/− mutant zebrafish and WT siblings. The top 10 significantly enriched GO terms in biological process (BP), cellular component (CC), and molecular function (MF) for all DEGs at 5 dpf (A) and 35 dpf (B) are displayed. The ordinate axis represents the GO term while the abscissa axis represents the level of significance of GO term’s enrichment, expressed as −log10(padj). Different colors represent different functional categories. The numbers above each bar indicate the number of enriched DEGs for each GO term.
Figure 4
Figure 4
Gene ontology (GO) terms enrichment analysis for the separated downregulated and upregulated DEGs between cdkl5−/− mutant zebrafish and WT siblings. The top 10 enriched GO terms in biological process (BP), cellular component (CC), and molecular function (MF) for the downregulated (A,B) and upregulated (C,D) DEGs at 5 dpf (A,C) and 35 dpf (B,D). Stripped bars indicate the GO terms that were not statistically significant. The numbers in front of each bar indicate the number of enriched DEGs for each GO term.
Figure 5
Figure 5
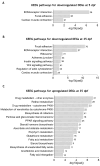
Enriched Kyoto Encyclopedia of Genes and Genomes (KEGG) pathways in zebrafish cdkl5−/− mutants compared to WT siblings. (A) Significantly enriched KEGG pathways for the downregulated DEGs at 5 dpf. (B) Significantly enriched KEGG pathways for the downregulated DEGs at 35 dpf. (C) Significantly enriched KEGG pathways for the upregulated DEGs at 35 dpf. The number of DEGs contributing to each pathway is shown in front of the corresponding bar.
Figure 6
Figure 6
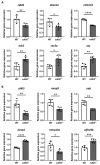
RT-qPCR analysis of a randomly selected set of DEG between cdkl5−/− mutant zebrafish and WT siblings at 5 dpf (A) and 35 dpf (B). Relative expression values are presented as mean±SD and statistical analysis was performed using Student’s t-test with Welch correction. *, **, ***, and **** indicate p < 0.05, p < 0.01, p < 0.001 and p < 0.0001, respectively.
Figure 7
Figure 7
Motor neuron alterations in cdkl5−/− zebrafish at 3 dpf. (A) Representative fluorescence images of the WT and cdkl5−/− motor neurons, labeled by Tg(hb9:GFP). (B) Number of motor neurons per hemisegment. (C) Axonal length of CaP motor neurons. Values are presented as mean ± SD and statistical analysis was performed using Student’s t-test with Welch correction. ** and **** indicate and p < 0.01 and p < 0.0001, respectively.

Similar articles

References

    1. Hector R.D., Dando O., Landsberger N., Kilstrup-Nielsen C., Kind P.C., Bailey M.E.S., Cobb S.R.C. Characterisation of CDKL5 transcript isoforms in human and mouse. PLoS ONE. 2016;11:e0157758. doi: 10.1371/journal.pone.0157758. - DOI - PMC - PubMed
    1. Kilstrup-Nielsen C., Rusconi L., La Montanara P., Ciceri D., Bergo A., Bedogni F., Landsberger N. What we know and would like to know about CDKL5 and its involvement in epileptic encephalopathy. Neural Plast. 2012;2012:728267. doi: 10.1155/2012/728267. - DOI - PMC - PubMed
    1. Rusconi L., Salvatoni L., Giudici L., Bertani I., Kilstrup-Nielsen C., Broccoli V., Landsberger N. CDKL5 expression is modulated during neuronal development and its subcellular distribution is tightly regulated by the C-terminal tail. J. Biol. Chem. 2008;283:30101–30111. doi: 10.1074/jbc.M804613200. - DOI - PMC - PubMed
    1. Chen Q., Zhu Y.-C., Yu J., Miao S., Zheng J., Xu L., Zhou Y., Li D., Zhang C., Tao J., et al. CDKL5, a Protein Associated with Rett Syndrome, Regulates Neuronal Morphogenesis via Rac1 Signaling. J. Neurosci. 2010;30:12777–12786. doi: 10.1523/JNEUROSCI.1102-10.2010. - DOI - PMC - PubMed
    1. Ricciardi S., Ungaro F., Hambrock M., Rademacher N., Stefanelli G., Brambilla D., Sessa A., Magagnotti C., Bachi A., Giarda E., et al. CDKL5 ensures excitatory synapse stability by reinforcing NGL-1-PSD95 interaction in the postsynaptic compartment and is impaired in patient iPSC-derived neurons. Nat. Cell Biol. 2012;14:911–923. doi: 10.1038/ncb2566. - DOI - PMC - PubMed

Substances

Supplementary concepts

LinkOut - more resources