. 2025 Jun 26;26(13):6136.
doi: 10.3390/ijms26136136.

Kinetics of Phase Transitions in Amorphous Carbamazepine: From Sub- Tg Structural Relaxation to High-Temperature Decomposition

Affiliations

Kinetics of Phase Transitions in Amorphous Carbamazepine: From Sub- Tg Structural Relaxation to High-Temperature Decomposition

Roman Svoboda et al. Int J Mol Sci. .

Abstract

Thermokinetic characterization of amorphous carbamazepine was performed utilizing non-isothermal differential scanning calorimetry (DSC) and thermogravimetry (TGA). Structural relaxation of the amorphous matrix was described in terms of the Tool-Narayanaswamy-Moynihan model with the following parameters: Δh* ≈ 200-300 kJ·mol-1, β = 0.57, x = 0.44. The crystallization of the amorphous phase was modeled using complex Šesták-Berggren kinetics, which incorporates temperature-dependent activation energy and degree of autocatalysis. The activation energy of the crystal growth was determined to be >320 kJ·mol-1 at the glass transition temperature (Tg). Owing to such a high value, the amorphous carbamazepine is stable at Tg, allowing for extensive processing of the amorphous phase (e.g., self-healing of the quench-induced mechanical defects or internal stress). A discussion was conducted regarding the converse relation between the activation energies of relaxation and crystal growth, which is possibly responsible for the absence of sub-Tg crystal growth modes. The high-temperature thermal decomposition of carbamazepine proceeds via multistep kinetics, identically in both an inert and an oxidizing atmosphere. A complex reaction mechanism, consisting of a series of consecutive and competing reactions, was proposed to explain the second decomposition step, which exhibited a temporary mass increase. Whereas a negligible degree of carbamazepine degradation was predicted for the temperature characteristic of the pharmaceutical hot-melt extrusion (~150 °C), the degradation risk during the pharmaceutical 3D printing was calculated to be considerably higher (1-2% mass loss at temperatures 190-200 °C).

Keywords: carbamazepine; crystal growth; structural relaxation; thermal decomposition.


Conflict of interest statement

The authors declare no conflicts of interest.

Figures
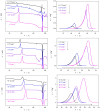
Figure 1
Figure 1
Raw DSC heating curves (right column); crystallization signals with subtracted thermokinetic background (left column). Exothermic effects evolve in an upward direction.
Figure 2
Figure 2
Temperature programs for the CR and CHR structural relaxation experiments (left column), and the corresponding DSC responses (right column). Exothermic effects evolve in an upward direction.
Figure 3
Figure 3
Selected joint DTA-TGA signals obtained for the CBZ decomposition in N2 and air atmospheres (left column)—exothermic effects evolve in a downward direction; the (right column) depicts full sets of TGA measurements.
Figure 4
Figure 4
The top left and right micrographs show the amorphous CBZ sample heated to 80 °C for 5 and 10 min, respectively. Bottom graphs show the Raman spectra (full and zoomed-in on the low-phonon part) of the amorphous, as-purchased, DSC crystalized, and surface-crystallized (crystals from the micrograph above) CBZ samples.
Figure 5
Figure 5
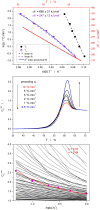
(Top graph): Evaluation of Δh* from CR and CHR cycles with the listed values corresponding to the linear fits (bottom and left axes); Δh*-T dependence determined from the CR cycles evaluation fit by the 2nd-order polynomial (top and right axes). (Middle graph): Normalized set of CHR cycles. (Bottom graph): Application of the simulation-comparative method to the present data—points show the experimental data from the middle graph, thin lines depict selected simulated dependences for various β&x combinations, thick red line shows the best correspondence between the experimental and simulated data (β = 0.57, x = 0.44).
Figure 6
Figure 6
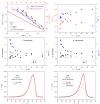
(Top left graph): Kissinger evaluation of E using the temperatures corresponding to the crystallization peak onset and maximum with the listed values corresponding to the linear fits (bottom and left axes); E-T dependence determined from the Tp values fit by the 2nd-order polynomial (top and right axes). (Top right and middle graphs): q+ dependences of kinetic parameters determined by means of the sc-MKA method. (Bottom graphs): Example crystallization signal fit by either one or two AC processes.
Figure 7
Figure 7
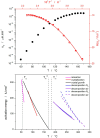
(Top left graph): Kissinger evaluation of E using the temperatures corresponding to the TGA points of inflection determined from the derivative TGA data for the two step-like mass losses (bottom and left axes); E-T dependences determined from the Kissinger dependences fit by the 2nd-order polynomials (top and right axes). (Top right graph): Example TGA data (measured under N2 atmosphere) fit by the sc-MKA method employing the depicted reaction scheme. (Bottom graphs): Kinetic predictions calculated using the kinetic parameters determined for the 0.1 °C·min−1 TGA data-curve obtained under N2 atmosphere—the predictions were calculated for isothermal annealing at denoted temperatures characteristic for the processes of pharmaceutical hot melt extrusion and 3D printing.
Figure 8
Figure 8
(Top graph): Crystal growth rate data taken from [25] and transformed to evaluate the activation energy EG. (Bottom graph): Activation energies determined for various thermally induced processes occurring in (amorphous) CBZ. “Crystallization” and “crystal growth” denote the data from DSC and microscopy, respectively.
Scheme 1
Scheme 1
Molecular structure of carbamazepine.

Similar articles

References

    1. Yan R., Tuo J., Tai Z., Zhang H., Yang J., Yu C., Xu Z. Management of anti-seizure medications in lactating women with epilepsy. Front. Neurol. 2022;13:1005890. doi: 10.3389/fneur.2022.1005890. - DOI - PMC - PubMed
    1. Hakami T. Efficacy and tolerability of antiseizure drugs. Ther. Adv. Neurol. Disord. 2021;14:17562864211037430. doi: 10.1177/17562864211037430. - DOI - PMC - PubMed
    1. Cornett E.M., Amarasinghe S.N., Angelette A., Abubakar T., Kaye A.M., Kaye A.D., Neuchat E.E., Urits I., Viswanath O. Valtoco® (Diazepam nasal spray) for the acute treatment of intermittent stereotypic episodes of frequent seizure activity. Neurol. Int. 2021;13:64–78. doi: 10.3390/neurolint13010007. - DOI - PMC - PubMed
    1. Mirza N., Stevelink R., Taweel B., Koeleman B.P., Marson A.G. Using common genetic variants to find drugs for common epilepsies. Brain Commun. 2021;3:fcab287. doi: 10.1093/braincomms/fcab287. - DOI - PMC - PubMed
    1. Nierenberg A.A., Agustini B., Köhler-Forsberg O., Cusin C., Katz D., Sylvia L.G., Peters A., Berk M. Diagnosis and treatment of bipolar disorder: A review. JAMA. 2023;330:1370–1380. doi: 10.1001/jama.2023.18588. - DOI - PubMed

LinkOut - more resources