. 2025 Jun 27;26(13):6197.
doi: 10.3390/ijms26136197.

Neuroferritinopathy Human-Induced Pluripotent Stem Cell-Derived Astrocytes Reveal an Active Role of Free Intracellular Iron in Astrocyte Reactivity

Affiliations

Neuroferritinopathy Human-Induced Pluripotent Stem Cell-Derived Astrocytes Reveal an Active Role of Free Intracellular Iron in Astrocyte Reactivity

Andrea Stefano Moro et al. Int J Mol Sci. .

Abstract

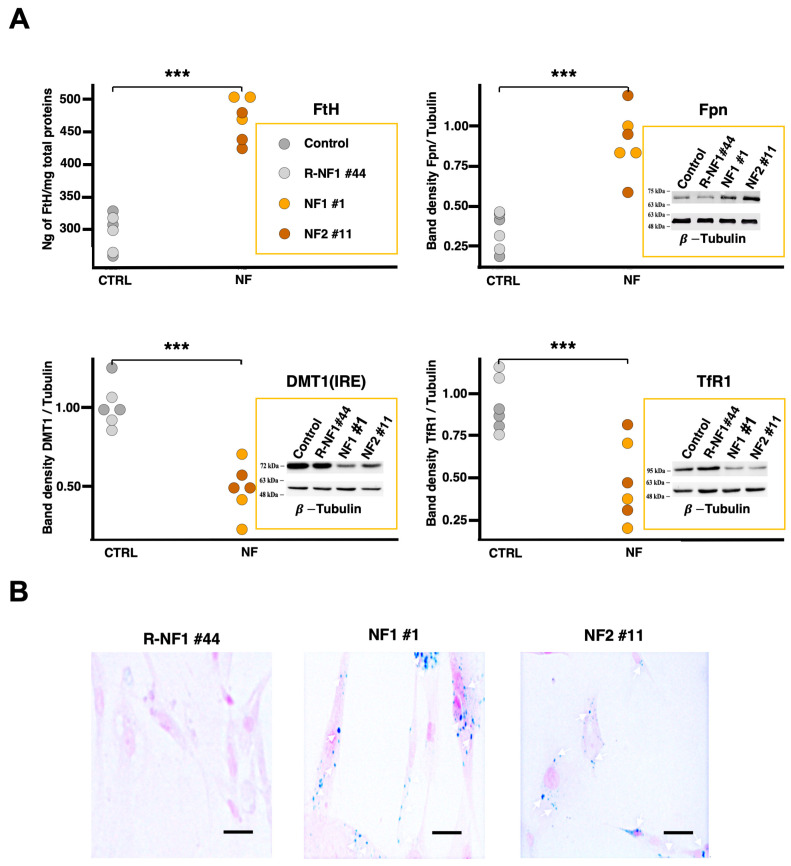
Increased iron levels, common in neurodegenerative diseases, correlate with disease severity, suggesting a role in the pathological process. Recently, efforts have been made to understand the role of iron in cerebral inflammatory processes. Employing astrocyte cell models of genetic neurodegenerative pathologies characterized by iron imbalance, such as the neurodegeneration with brain iron accumulation disorders, can provide valuable insights into astrocytes reactivity, a pivotal process in brain inflammation. Specifically, we employed human-induced pluripotent stem cell-derived astrocytes from Neuroferritinopathy, where iron accumulation is primary. After confirming iron accumulation and the deregulation of proteins involved in iron management, we observed that at 35 days since the beginning of differentiation, the elevated iron levels not only trigger ferroptosis but also place the astrocytes in a reactive state. This is evident in the higher extracellular concentrations of IL-6, IL-1β, and glutamate, along with changes in morphology, genes, and proteins involved in astrocyte reactivity. Interestingly, by day 60, IL-6 and IL-1β levels drop below those of the controls, and we observe a reversal in most of the factors considered. Moreover, at day 60, it is possible to observe not only increased senescence but also ferroptosis. These findings demonstrate that iron plays a primary role in inducing astrocyte reactivity.

Keywords: ferroptosis; iron homeostasis; neurodegenerative diseases; neuroferritinopathy; neuroinflammation.


Conflict of interest statement

The authors declare that they have no competing interests.

Figures

Figure 1
Figure 1
Iron dyshomeostasis in neuroferritinopathy. (A) Quantification of iron-related protein levels in differentiated astrocytes derived from hiPSCs. The top left panel displays the results of an ELISA assay measuring FtH levels. The top right, bottom left, and bottom right panels show the quantification of band densities from Western blot analyses of Fpn, DMT1, and TfR1, respectively. Experiments were conducted on cell lysates collected at different time points in vitro (days 35 and 60 of differentiation). The graphs represent data analyzed using linear mixed-effects (LME) models as described in the Materials and Methods section (Equation (1): Y = NF + Time + (1|Sample)), which included pathology (NF) as a fixed effect. The significance bracket above the groups indicates the overall statistical significance of the pathology effect across the tested time points, as determined by Type III ANOVA on the LME model (FtH: χ21 = 120.1871, p < 0.0001; Fpn: χ21 = 51.6462, p < 0.0001; DMT1: χ21 = 69.6683, p < 0.0001; TfR1: χ21 = 21.3097, p < 0.0001). (B) Representative images of Perls staining performed on d-astrocytes from neuroferritinopathy patients and healthy controls at day 60 of in vitro differentiation. The blue staining indicates the presence of ferric iron accumulation, which is visibly increased in patient-derived astrocytes compared to controls. Scale bars, 20 µm. *** p < 0.001, as determined by the LME model.
Figure 2
Figure 2
Astrocytic reactivity. (A) Morphological analysis of paraformaldehyde-fixed d-astrocytes immunostained with anti β-actin. Scale bars, 20 µm. The left graph displays the mean values with SEM for the major-to-minor axis ratio, while the right graph shows the mean values with SEM for the total area of the astrocytes. Individual data points are color-coded to represent different conditions: gray points indicate control astrocytes at day 35, black points represent control astrocytes at day 60, light red points represent patient-derived astrocytes at day 35, and dark red points represent patient-derived astrocytes at day 60. The graphs show results from two independent experiments analyzed using LME models as described in the Materials and Methods section (Equation (2): Y = NF + Day + NF∗Day + (1|Sample)), which included pathology (NF) as fixed effect, along with their interaction (NF × Day). Two significance brackets are displayed above each graph: the upper bracket indicates the statistical significance of the interaction effect between pathology and Day, whereas the lower bracket corresponds to the main effect of pathology across both time points (NF × Day for Major/Minor Axis: χ21 = 7.8444, p = 0.0051; NF×Day for Area: χ21 = 4.8357, p = 0.0279). (B) Graph showing the quantification of extracellular Interleukin-6 (IL-6) levels over time in the cell culture medium of differentiated astrocytes. The graph displays the mean values with SEM from two independent experiments. * p < 0.05, ** p < 0.01, as determined by the LME model.
Figure 3
Figure 3
Astrocytic reactivity: extracellular composition analysis and Western blot. (A) Amount of IL-1β (left), IL-6 (middle), and glutamate (right) released by d-astrocytes normalized to cell total protein content. The graphs show the results of three independent experiments analyzed using LME models as described in the Materials and Methods section (Equation (2): Y = NF + Day + NF∗Day + (1|Sample)), which included pathology (NF) as fixed effect, along with their interaction (NF × Day). Two significance brackets are displayed above each graph: the upper bracket indicates the statistical significance of the interaction effect between pathology and day, whereas the lower bracket corresponds to the main effect of pathology across both time points (IL-1β = NF: χ21 = 273.3277, p < 0.0001; Day: χ21 = 9.5594, p = 0.0019; NF × Day: χ21 = 1436.2533, p < 0.0001; IL-6 = NF: χ21 = 1515.479, p < 0.0001; Day: χ21 = 11.438, p = 0.0007; NF × Day: χ21 = 1479.714, p < 0.0001). (B) Representative Western blot images (top) and related quantification graphs (bottom) of NRF2 (left), LCN2 (middle), and EAAT2 (right). Individual data points on the graphs are color-coded to represent different conditions: gray points indicate control astrocytes at day 35, black points represent control astrocytes at day 60, light red points represent patient-derived astrocytes at day 35, and dark red points represent patient-derived astrocytes at day 60. The graphs show results from three independent experiments analyzed using LME models as described in the Materials and Methods section (Equation (2): Y = NF + Day + NF∗Day + (1|Sample)), which included pathology (NF) as fixed effect, along with their interaction (NF × Day). Two significance brackets are displayed above each graph: the upper bracket indicates the statistical significance of the interaction effect between pathology and day, whereas the lower bracket corresponds to the main effect of pathology across both time points (NRF2: NF: χ21 = 26.6379, p < 0.0001; NF × Day: χ21 = 9.0012, p = 0.0027; LCN2: NF: χ21 = 25.4127, p < 0.0001; NF × Day: χ21 = 14.2569, p = 0.0002). *** p < 0.001, ** p < 0.01, as determined by the LME model.
Figure 4
Figure 4
Astrocytic reactivity: rt-qPCR. Relative amount of IL-6 (top left, NF: χ21 = 9.4851, p = 0.0021; Day: χ21 = 7.2863, p = 0.0069; NF × Day: χ21 = 90.1495, p < 0.0001), iNOS (top right, NF: χ21 = 20.6667, p < 0.0001; Day: χ21 = 13.2794, p = 0.0003; NF × Day: χ21 = 47.0830, p < 0.0001), GFAP (bottom left, NF×Day: χ21 = 8.6265, p = 0.0033), and TNFα gene (bottom right) expression in d-astrocytes tested by RT-qPCR. The graphs display the mean values with SEM from three independent experiments analyzed using LME models as described in the Materials and Methods section (Equation (3): Y = NF + Day + NF∗Day + (1|Sample) + (1|Session)), which included pathology (NF) as fixed effect, along with their interaction (NF × Day). Two significance brackets are displayed above each graph: the upper bracket indicates the statistical significance of the interaction effect between pathology and day, whereas the lower bracket corresponds to the main effect of pathology across both time points. * p < 0.05, ** p < 0.01, *** p < 0.001, as determined by the LME model.
Figure 5
Figure 5
Iron variation over two time intervals. Graph showing the amount of total iron in astrocytes normalized to total protein concentration on days 35 and 60 (left) from three independent experiments; evaluation of cytosolic LIP on days 35 and 60 in d-astrocytes stained with the specific probe calcein (right) from two independent experiments, displaying the mean values with SEM. Two significance brackets are displayed above each graph: the upper one represents the statistical significance of the interaction effect, whereas the lower one corresponds to the main effect of pathology. (Total Iron: NF: χ21 = 82.9721, p < 0.0001; NF × Day: χ21 = 58.1272, p < 0.0001; Cytosolic LIP: NF: χ21 = 36.2617, p < 0.0001; NF × Day: χ21 = 43.4074, p < 0.0001). *** p < 0.001, as determined by the LME model.
Figure 6
Figure 6
Cellular senescence. (A) Representative bright field images of SA-β-gal activity staining in control and NF patient-derived d-astrocytes. Scale bars, 20 µm. Positively stained (blue) cells were counted and plotted as the percentage of the total cells. Individual data points are color-coded to represent different conditions: gray points indicate control astrocytes at day 35, black points represent control astrocytes at day 60, light red points represent patient-derived astrocytes at day 35, and dark red points represent patient-derived astrocytes at day 60. The graph shows results from three independent experiments analyzed using LME models as described in the Materials and Methods section (Equation (2): Y = NF + Day + NF∗Day + (1|Sample)), which included pathology (NF) as fixed effect, along with their interaction (NF × Day). Two significance brackets are displayed above the graph: the upper bracket indicates the statistical significance of the interaction effect between pathology and day, whereas the lower bracket corresponds to the main effect of pathology across both time points (NF: χ21 = 7.3874, p = 0.006568; DAY: χ21 = 10.0753, p = 0.001503; NF × DAY: χ21 = 44.1732, p < 0.0001). (B) Representative Western blot image of soluble cell homogenates from differentiated astrocytes at day 60, probed with anti-p62 antibody and anti-Actin antibody (as a loading control), with a graph showing the quantified protein levels via densitometry. The graph displays results from three independent experiments analyzed using LME models as described in the Materials and Methods section (Equation (1): Y = NF + Time + (1|Sample)), which included pathology (NF) as a fixed effect. The significance bracket above the groups indicates the overall statistical significance of the pathology effect (NF: χ21 = 2.993, p = 0.0151). ** p < 0.01, *** p < 0.001, as determined by the LME model.
Figure 7
Figure 7
Ferroptosis over two time intervals. Representative Western blot images (top) and related quantification graphs (bottom) of MDA (left, NF: χ21 = 31.7777, p < 0.0001; NF × Day: χ21 = 12.6027, p = 0.0004) and GPX4 (right, NF: χ21 = 24.0535, p < 0.0001; NF× Day: χ21 = 26.5102, p < 0.0001), both measured at two time points (day 35 and day 60). Individual data points on the graphs are color-coded to represent different conditions: gray points indicate control astrocytes at day 35, black points represent control astrocytes at day 60, light red points represent patient-derived astrocytes at day 35, and dark red points represent patient-derived astrocytes at day 60. The graphs show results from three independent experiments analyzed using LME models as described in the Materials and Methods section (Equation (2): Y = NF + Day + NF∗Day + (1|Sample)), which included pathology (NF) as fixed effect, along with their interaction (NF × Day). Two significance brackets are displayed above each graph: the upper bracket indicates the statistical significance of the interaction effect between pathology and day, whereas the lower bracket corresponds to the main effect of pathology across both time points. *** p < 0.001, as determined by the LME model.

References

    1. Levi S., Ripamonti M., Moro A.S., Cozzi A. Iron imbalance in neurodegeneration. Mol. Psychiatry. 2024;29:1139–1152. doi: 10.1038/s41380-023-02399-z. - DOI - PMC - PubMed
    1. Levi S., Tiranti V. Neurodegeneration with Brain Iron Accumulation Disorders: Valuable Models Aimed at Understanding the Pathogenesis of Iron Deposition. Pharmaceuticals. 2019;12:27. doi: 10.3390/ph12010027. - DOI - PMC - PubMed
    1. Curtis A.R.J., Fey C., Morris C.M., Bindoff L.A., Ince P.G., Chinnery P.F., Coulthard A., Jackson M.J., Jackson A.P., McHale D.P., et al. Mutation in the gene encoding ferritin light polypeptide causes dominant adult-onset basal ganglia disease. Nat. Genet. 2001;28:350–354. doi: 10.1038/ng571. - DOI - PubMed
    1. Lehn A., Boyle R., Brown H., Airey C., Mellick G. Neuroferritinopathy. Park. Relat. Disord. 2012;18:909–915. doi: 10.1016/j.parkreldis.2012.06.021. - DOI - PubMed
    1. McNeill A., Chinnery P.F. Neuroferritinopathy: Update on Clinical Features and Pathogenesis. Curr. Drug Targets. 2012;13:1200–1203. doi: 10.2174/138945012802002375. - DOI - PubMed

MeSH terms

Supplementary concepts

LinkOut - more resources